GstInference/Benchmarks: Difference between revisions
Tag: Undo |
|||
| Line 178: | Line 178: | ||
} | } | ||
</style> | </style> | ||
<div id="Buttons_Model" style="margin: auto; width: 1300px; height: auto;"> | |||
<button class="button" id="show_inceptionv1">Show InceptionV1 </button> | <button class="button" id="show_inceptionv1">Show InceptionV1 </button> | ||
<button class="button" id="show_inceptionv2">Show InceptionV2 </button> | <button class="button" id="show_inceptionv2">Show InceptionV2 </button> | ||
| Line 189: | Line 188: | ||
<br><br> | <br><br> | ||
<div id="chart_div" style="margin: auto; width: 800px; height: 500px;"></div> | <div id="chart_div" style="margin: auto; width: 800px; height: 500px;"></div> | ||
<br><br> | |||
<div id="Buttons_Backend" style="margin: auto; width: 600px; height: auto;"> | |||
<button class="button" id="show_onnxrt">Show ONNXRT </button> | |||
</div> | |||
<div id="chart_div1" style="margin: auto; width: 800px; height: 500px;"></div> | |||
<br><br> | <br><br> | ||
| Line 195: | Line 200: | ||
google.charts.setOnLoadCallback(drawStuff); | google.charts.setOnLoadCallback(drawStuff); | ||
function drawStuff() { | function drawStuff() { | ||
var chartDiv = document.getElementById('chart_div'); | var chartDiv = document.getElementById('chart_div'); | ||
var chartDiv1 = document.getElementById('chart_div1'); | |||
var table_backend_platform_fps = google.visualization.arrayToDataTable([ | var table_backend_platform_fps = google.visualization.arrayToDataTable([ | ||
| Line 209: | Line 216: | ||
['x86', 47.8702, 32.7236, 12.092, 5.2632, 16.03, 18.3592] | ['x86', 47.8702, 32.7236, 12.092, 5.2632, 16.03, 18.3592] | ||
]); | ]); | ||
var table_model_platform_fps = google.visualization.arrayToDataTable([ | |||
['Model', //Colunm 0 | |||
'ONNXRT \n x86', //Colunm 1 | |||
['InceptionV1', 47.8702], //row 1 | |||
['InceptionV2', 32.7236], //row 2 | |||
['InceptionV3', 12.092], //row 3 | |||
['InceptionV4', 5.2632], //row 4 | |||
['TinyYoloV2', 16.03], //row 5 | |||
['TinyYoloV3', 18.3592] //row 6 | |||
]); | |||
var materialOptions = { | var materialOptions = { | ||
width: | width: 350, | ||
chart: { | |||
title: 'Model vs Platform per backend', | |||
}, | |||
series: { | |||
}, | |||
axes: { | |||
y: { | |||
distance: {side: 'left',label: 'FPS'}, // Left y-axis. | |||
} | |||
} | |||
}; | |||
var materialOptions1 = { | |||
width: 400, | |||
chart: { | chart: { | ||
title: 'Model | title: 'Model vs backend per platform', | ||
}, | }, | ||
series: { | series: { | ||
| Line 225: | Line 254: | ||
var materialChart_fps = new google.charts.Bar(chartDiv); | var materialChart_fps = new google.charts.Bar(chartDiv); | ||
var materialChart1_fps = new google.charts.Bar(chartDiv1); | |||
view_fps = new google.visualization.DataView(table_backend_platform_fps); | view_fps = new google.visualization.DataView(table_backend_platform_fps); | ||
view1_fps = new google.visualization.DataView(table_model_platform_fps); | |||
function drawMaterialChart() { | function drawMaterialChart() { | ||
var materialChart_fps = new google.charts.Bar(chartDiv); | var materialChart_fps = new google.charts.Bar(chartDiv); | ||
var materialChart1_fps = new google.charts.Bar(chartDiv1); | |||
materialChart_fps.draw(table_backend_platform_fps, google.charts.Bar.convertOptions(materialOptions)); | materialChart_fps.draw(table_backend_platform_fps, google.charts.Bar.convertOptions(materialOptions)); | ||
materialChart1_fps.draw(table_model_platform_fps, google.charts.Bar.convertOptions(materialOptions1)); | |||
init_charts(); | init_charts(); | ||
} | } | ||
| Line 236: | Line 269: | ||
view_fps.hideColumns([2,3,4,5,6]); | view_fps.hideColumns([2,3,4,5,6]); | ||
materialChart_fps.draw(view_fps, materialOptions); | materialChart_fps.draw(view_fps, materialOptions); | ||
view_fps.setColumns([0,1]); | |||
view_fps.hideColumns([2,3,4,5,6]); | |||
materialChart1_fps.draw(view1_fps, materialOptions1); | |||
} | } | ||
Revision as of 22:34, 6 July 2020
Make sure you also check GstInference's companion project: R2Inference |
| GstInference |
|---|
 |
| Introduction |
| Getting started |
| Supported architectures |
|
InceptionV1 InceptionV3 YoloV2 AlexNet |
| Supported backends |
|
Caffe |
| Metadata and Signals |
| Overlay Elements |
| Utils Elements |
| Legacy pipelines |
| Example pipelines |
| Example applications |
| Benchmarks |
| Model Zoo |
| Project Status |
| Contact Us |
 |
GstInference Benchmarks
The following benchmarks were run with a source video (1920x1080@60). With the following base GStreamer pipeline, and environment variables:
$ VIDEO_FILE='video.mp4'
$ MODEL_LOCATION='graph_inceptionv1_tensorflow.pb'
$ INPUT_LAYER='input'
$ OUTPUT_LAYER='InceptionV1/Logits/Predictions/Reshape_1'
The environment variables were changed accordingly with the used model (Inception V1,V2,V3 or V4)
GST_DEBUG=inception1:1 gst-launch-1.0 filesrc location=$VIDEO_FILE ! decodebin ! videoconvert ! videoscale ! queue ! net.sink_model inceptionv1 name=net model-location=$MODEL_LOCATION backend=tensorflow backend::input-layer=$INPUT_LAYER backend::output-layer=$OUTPUT_LAYER net.src_model ! perf ! fakesink -v
The Desktop PC had the following specifications:
- Intel(R) Core(TM) i7-3770 CPU @ 3.40GHz
- 8 GB RAM
- Cedar [Radeon HD 5000/6000/7350/8350 Series]
- Linux 4.15.0-54-generic x86_64 (Ubuntu 16.04)
The Jetson Xavier power modes used were 2 and 6 (more information: Supported Modes and Power Efficiency)
- View current power mode:
$ sudo /usr/sbin/nvpmodel -q
- Change current power mode:
sudo /usr/sbin/nvpmodel -m x
Where x is the power mode ID (e.g. 0, 1, 2, 3, 4, 5, 6).
Summary
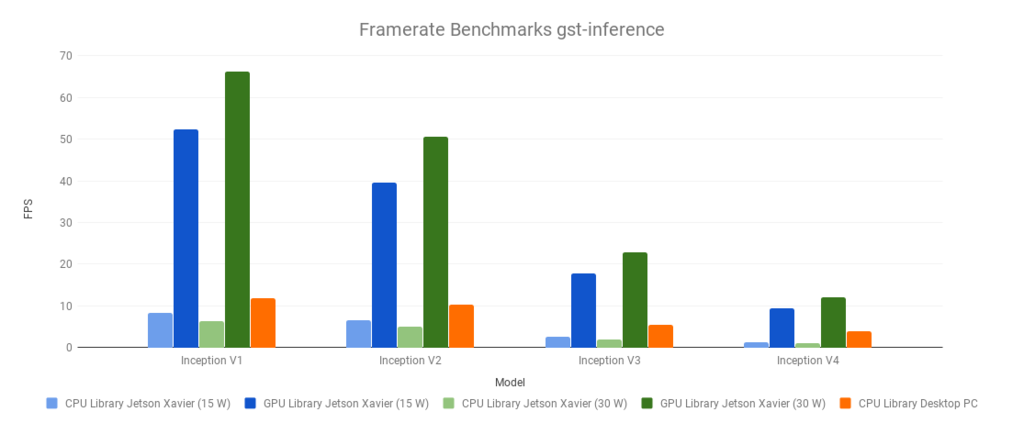
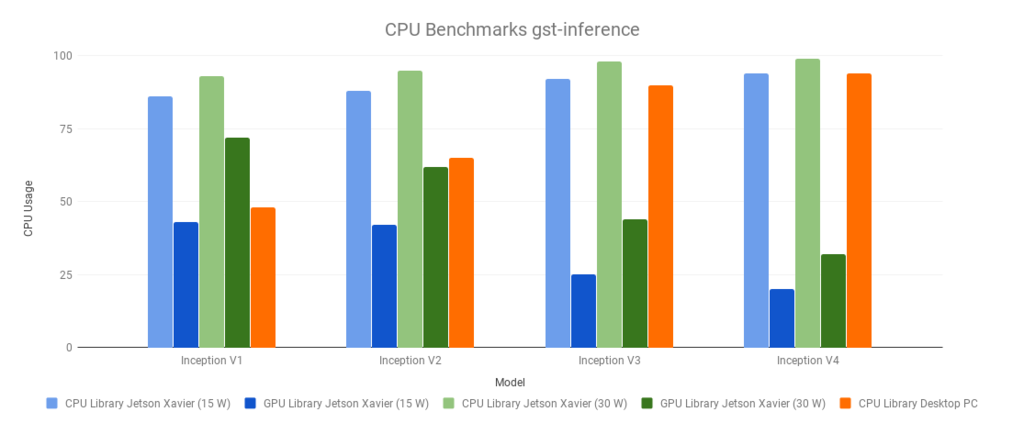
| Desktop PC | CPU Library | |
|---|---|---|
| Model | Framerate | CPU Usage |
| Inception V1 | 11.89 | 48 |
| Inception V2 | 10.33 | 65 |
| Inception V3 | 5.41 | 90 |
| Inception V4 | 3.81 | 94 |
| Jetson Xavier (15W) | CPU Library | GPU Library | ||
|---|---|---|---|---|
| Model | Framerate | CPU Usage | Framerate | CPU Usage |
| Inception V1 | 8.24 | 86 | 52.3 | 43 |
| Inception V2 | 6.58 | 88 | 39.6 | 42 |
| Inception V3 | 2.54 | 92 | 17.8 | 25 |
| Inception V4 | 1.22 | 94 | 9.4 | 20 |
| Jetson Xavier (30W) | CPU Library | GPU Library | ||
|---|---|---|---|---|
| Model | Framerate | CPU Usage | Framerate | CPU Usage |
| Inception V1 | 6.41 | 93 | 66.27 | 72 |
| Inception V2 | 5.11 | 95 | 50.59 | 62 |
| Inception V3 | 1.96 | 98 | 22.95 | 44 |
| Inception V4 | 0.98 | 99 | 12.14 | 32 |
Framerate

CPU Usage

TensorFlow Lite Benchmarks
FPS measurement
CPU usage measurement
Test benchmark video
The following video was used to perform the benchmark tests.
To download the video press right click on the video and select 'Save video as' and save this in your computer.
ONNXRT Benchmarks
FPS Measurements
CPU Load Measurements
Test benchmark video
The following video was used to perform the benchmark tests.
To download the video press right click on the video and select 'Save video as' and save this in your computer.
