GStreamer Video Stabilizer for NVIDIA Jetson Boards/Performance/TX1/TX2: Difference between revisions
| Line 70: | Line 70: | ||
|} | |} | ||
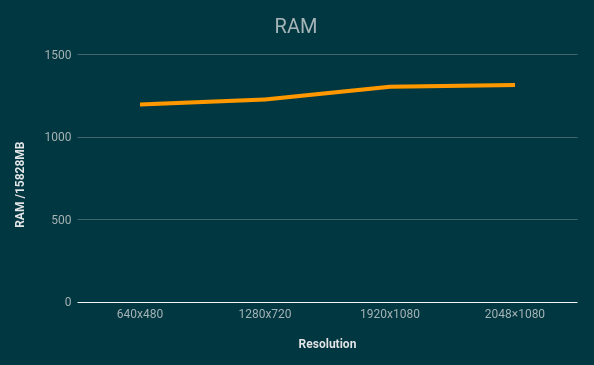
[[File:RAM tx2.png|frame|center|RAM consumption for different resolutions.]] | [[File:RAM tx2.png|frame|center|RAM consumption for different resolutions.]] | ||
== Glass-to-glass latency == | == Glass-to-glass latency == | ||
Revision as of 23:18, 13 June 2019
| GStreamer Video Stabilizer |
|---|
| Video Stabilization Basics |
| User Guide |
| Getting Started |
| Examples |
| Performance |
| Contact Us |
The following section describes some relevant performance measurements during video stabilization for a few standard resolutions. It begins with a summary of the results detailed on the following sections, as well as the pipelines used to capture such results.
Summary
Benchmarking
Standalone element
Pipeline
All the measurements bellow where made using the following minimal pipeline.
PATH_TO_FILE=path_to_file.rgba
WIDTH=1920
HEIGHT=1080
FRAME_SIZE=$(($WIDTH * $HEIGHT * 4))

gst-launch-1.0  filesrc location=$PATH_TO_FILE blocksize=$FRAME_SIZE ! videoparse format=rgba width=$WIDTH height=$HEIGHT ! nvstabilize ! fakesink sync=true
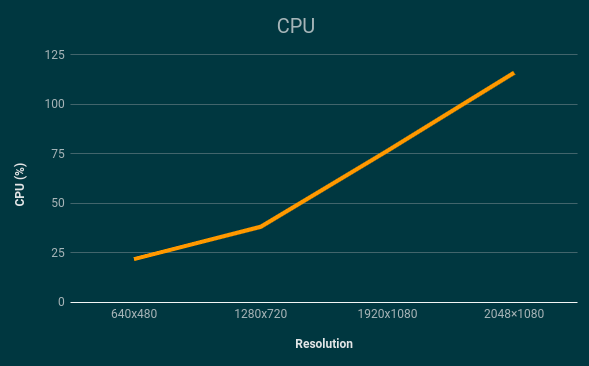
CPU
| Resolution | CPU 0 | CPU 1 | CPU 2 | CPU 3 | Average (reported by top) |
|---|---|---|---|---|---|
| 640x480@25Fps | 68.48 | 0 | 0 | 56 | 45.9 |
| 1280x720@25Fps | 40.97 | 0 | 0 | 36.97 | 54.5 |
| 1920x1080@25Fps | 42.05 | 1.44 | 1.27 | 4.055 | 53,9 |
| 2048×1080@25Fps | 15.45 | 0 | 0 | 37.3 | 52,7 |
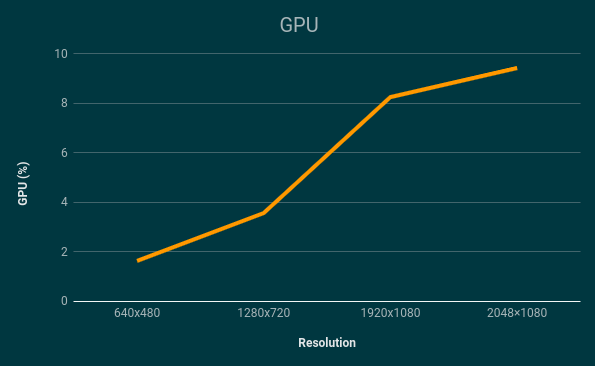
GPU
| Resolution | GPU |
|---|---|
| 640x480@25Fps | 21.58 |
| 1280x720@25Fps | 29.41 |
| 1920x1080@25Fps | 37.69 |
| 2048×1080@25Fps | 35.11 |
RAM
| Resolution | RAM |
|---|---|
| 640x480@25Fps | 1442/7861MB |
| 1280x720@25Fps | 1443/7861MB |
| 1920x1080@25Fps | 1446/7861MB |
| 2048×1080@25Fps | 1480/7861MB |
Glass-to-glass latency
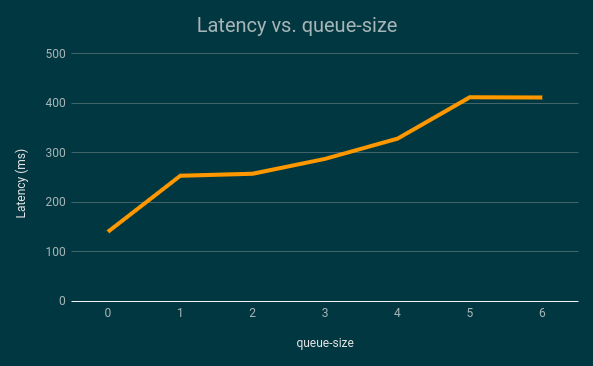
Latency was measured as shown in the picture, and the following are the approximate results. It is important to notice that latency can be affected by the parameters selected on the pipeline, specifically the queue-size property of the gst-nvstabilize element, as further explained on the User Guide. The pipeline used was the following:
gst-launch-1.0 v4l2src device=/dev/video0 ! 'video/x-raw,width=1280,height=720' ! nvvidconv ! 'video/x-raw(memory:NVMM),width=1280,height=720,format=RGBA' ! nvvidconv ! queue max-size-buffers=1 leaky=downstream ! nvstabilize queue-size=5 ! nvvidconv ! nvoverlaysink sync=false
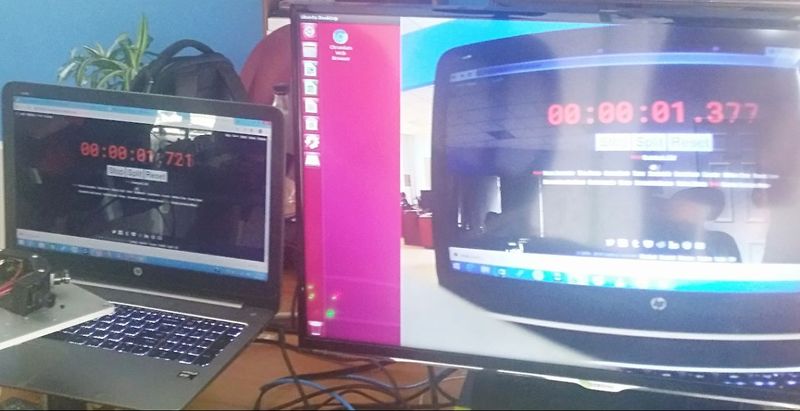
1280x720@30Fps
| queue-size | Latency (ms) |
|---|---|
| No stabilizer | 140.8 |
| 1 | 254 |
| 2 | 258 |
| 3 | 288 |
| 4 | 328.8 |
| 5 | 412.6 |
| 6 | 412 |
