Spherical Video PTZ/Performance/Jetson AGX Xavier: Difference between revisions
No edit summary |
|||
| (15 intermediate revisions by 2 users not shown) | |||
| Line 18: | Line 18: | ||
As previously mentioned, the Spherical Video PTZ features an [[Spherical Video PTZ/User Guide/Quick_Start_Guide#Spherical_Video_PTZ_Engine|engine wrapper]], designed for application development. This section aims to conduct performance measurements using the average value obtained after processing the input image through the 'Process' method of the Spherical Video PTZ engine wrapper. The values presented in the table below are the averages obtained after using the Process method '''1000 times'''. This testing was conducted using the '''8 cores''' of the '''MODE_30W_ALL''' mode on a '''Jetson AGX Xavier''' with '''JetPack 5.1.2'''. | As previously mentioned, the Spherical Video PTZ features an [[Spherical Video PTZ/User Guide/Quick_Start_Guide#Spherical_Video_PTZ_Engine|engine wrapper]], designed for application development. This section aims to conduct performance measurements using the average value obtained after processing the input image through the 'Process' method of the Spherical Video PTZ engine wrapper. The values presented in the table below are the averages obtained after using the Process method '''1000 times'''. This testing was conducted using the '''8 cores''' of the '''MODE_30W_ALL''' mode on a '''Jetson AGX Xavier''' with '''JetPack 5.1.2'''. | ||
{| class="wikitable sortable" style="text-align:center;" | {| class="wikitable sortable" style="text-align:center;" | ||
| Line 49: | Line 48: | ||
| 12 || CudaImage || Yes || 4000x2000 || 1000x1000 || (phys) 172.00 || (Usage) 5.70 % (VRAM) 11.00 MiB || 2.09 % || 19.471 | | 12 || CudaImage || Yes || 4000x2000 || 1000x1000 || (phys) 172.00 || (Usage) 5.70 % (VRAM) 11.00 MiB || 2.09 % || 19.471 | ||
|} | |} | ||
Please consider the following points: | Please consider the following points: | ||
| Line 59: | Line 57: | ||
===Gstreamer element: rrpanoramaptz=== | ===Gstreamer element: rrpanoramaptz=== | ||
====Processing using system memory==== | ====Processing time using system memory==== | ||
Each of the following sections presents the pipeline used for the performance test and the resulting performance graph, depicting the processing time without PTZ transformations for different video resolutions and output sizes. | |||
'''2000x1000 input to 500x500 output''' | |||
'' | ''Pipeline Used:'' | ||
<syntaxhighlight lang=bash> | <syntaxhighlight lang=bash> | ||
GST_DEBUG="GST_TRACER:7" GST_TRACERS="proctime" gst-launch-1.0 videotestsrc is-live=true num-buffers=200 ! queue max-size-buffers=0 max-size-time=0 max-size-bytes=0 ! "video/x-raw,width=2000,height=1000" ! rrpanoramaptz ! "video/x-raw,width=500,height=500" ! fakesink | GST_DEBUG="GST_TRACER:7" GST_TRACERS="proctime" gst-launch-1.0 videotestsrc is-live=true num-buffers=200 ! queue max-size-buffers=0 max-size-time=0 max-size-bytes=0 ! "video/x-raw,width=2000,height=1000" ! rrpanoramaptz ! "video/x-raw,width=500,height=500" ! fakesink | ||
</syntaxhighlight> | </syntaxhighlight> | ||
[[File:9-perf.svg|thumbnail|center|640px|Element performance]] | ''Resulting Graph:'' | ||
[[File:9-perf.svg|thumbnail|center|640px|Element performance|alt=Graphic with performance result]] | |||
'' | '''4000x2000 input to 500x500 output''' | ||
''Pipeline Used:'' | |||
<syntaxhighlight lang=bash> | <syntaxhighlight lang=bash> | ||
GST_DEBUG="GST_TRACER:7" GST_TRACERS="proctime" gst-launch-1.0 videotestsrc is-live=true num-buffers=200 ! queue max-size-buffers=0 max-size-time=0 max-size-bytes=0 ! "video/x-raw,width=4000,height=2000" ! rrpanoramaptz ! "video/x-raw,width=500,height=500" ! fakesink | GST_DEBUG="GST_TRACER:7" GST_TRACERS="proctime" gst-launch-1.0 videotestsrc is-live=true num-buffers=200 ! queue max-size-buffers=0 max-size-time=0 max-size-bytes=0 ! "video/x-raw,width=4000,height=2000" ! rrpanoramaptz ! "video/x-raw,width=500,height=500" ! fakesink | ||
</syntaxhighlight> | </syntaxhighlight> | ||
[[File:10-perf.svg|thumbnail|center|640px|Element performance]] | ''Resulting Graph:'' | ||
[[File:10-perf.svg|thumbnail|center|640px|Element performance|alt=Graphic with performance result]] | |||
'''4000x2000 input to 1000x1000 output''' | |||
'' | ''Pipeline Used:'' | ||
<syntaxhighlight lang=bash> | <syntaxhighlight lang=bash> | ||
GST_DEBUG="GST_TRACER:7" GST_TRACERS="proctime" gst-launch-1.0 videotestsrc is-live=true num-buffers=200 ! queue max-size-buffers=0 max-size-time=0 max-size-bytes=0 ! "video/x-raw,width=4000,height=2000" ! rrpanoramaptz ! "video/x-raw,width=1000,height=1000" ! fakesink | GST_DEBUG="GST_TRACER:7" GST_TRACERS="proctime" gst-launch-1.0 videotestsrc is-live=true num-buffers=200 ! queue max-size-buffers=0 max-size-time=0 max-size-bytes=0 ! "video/x-raw,width=4000,height=2000" ! rrpanoramaptz ! "video/x-raw,width=1000,height=1000" ! fakesink | ||
</syntaxhighlight> | </syntaxhighlight> | ||
[[File:11-perf.svg|thumbnail|center|640px|Element performance]] | ''Resulting Graph:'' | ||
[[File:11-perf.svg|thumbnail|center|640px|Element performance|alt=Graphic with performance result]] | |||
'''Summary''' | |||
This table summarizes the average processing time for different resolutions: | |||
{| class="wikitable sortable" style="text-align:center;" | |||
|+ Average processing time for different resolutions | |||
|- | |||
! Resolution (Input – Output) !! Processing Average (ms) | |||
|- | |||
| 2000x1000 – 500x500 || 1.08256 | |||
|- | |||
| 4000x2000 – 500x500 || 1.45138 | |||
|- | |||
| 4000x2000 – 1000x1000 || 1.81266 | |||
|} | |||
====Processing time with ptz transformations==== | |||
The bash script provided applies PTZ transformations to measure how they impact the processing time of the rrpanoramaptz element. The script sequentially applies a change in the pan position every 0.02 seconds, which introduces additional computational work for the processing element. This is reflected in the measured processing times, providing a realistic understanding of the element's performance under PTZ operations. | |||
<syntaxhighlight lang="bash" line> | |||
#!/bin/bash | |||
counter=0 | |||
gst-client pipeline_create p1 "videotestsrc is-live=true num-buffers=200 ! queue ! video/x-raw,width=4000,height=2000 ! rrpanoramaptz name=ptz ! video/x-raw,width=1000,height=1000 ! fakesink" | |||
gst-client pipeline_play p1 | |||
while [ $counter -lt 180 ]; do | |||
gst-client --quiet element_set p1 ptz pan ${counter} | |||
((counter++)) | |||
sleep 0.02 # pan rate of change | |||
done | |||
gst-client pipeline_stop p1 | |||
gst-client pipeline_delete p1 | |||
</syntaxhighlight> | |||
''Resulting Graph:'' | |||
[[File:15-perf.svg|thumbnail|center|640px|Element performance]] | |||
''Average processing time: 22.2574 ms''. | |||
The graph shows fluctuations in processing time, which align with the moments when pan transformations are applied by the script | |||
====Processing time using NVMM==== | ====Processing time using NVMM==== | ||
'' | '''2000x1000 input to 500x500 output''' | ||
''Pipeline Used:'' | |||
<syntaxhighlight lang=bash> | <syntaxhighlight lang=bash> | ||
GST_DEBUG="GST_TRACER:7" GST_TRACERS="proctime" gst-launch-1.0 videotestsrc is-live=true num-buffers=200 ! nvvidconv ! queue ! "video/x-raw(memory:NVMM),width=2000,height=1000" ! rrpanoramaptz ! "video/x-raw,width=500,height=500" ! fakesink | GST_DEBUG="GST_TRACER:7" GST_TRACERS="proctime" gst-launch-1.0 videotestsrc is-live=true num-buffers=200 ! nvvidconv ! queue ! "video/x-raw(memory:NVMM),width=2000,height=1000" ! rrpanoramaptz ! "video/x-raw,width=500,height=500" ! fakesink | ||
</syntaxhighlight> | </syntaxhighlight> | ||
''Resulting Graph:'' | |||
[[File:12-perf.svg|thumbnail|center|640px|Element performance]] | [[File:12-perf.svg|thumbnail|center|640px|Element performance]] | ||
'' | '''4000x2000 input to 500x500 output''' | ||
''Pipeline Used:'' | |||
<syntaxhighlight lang=bash> | <syntaxhighlight lang=bash> | ||
GST_DEBUG="GST_TRACER:7" GST_TRACERS="proctime" gst-launch-1.0 videotestsrc is-live=true num-buffers=200 ! nvvidconv ! queue ! "video/x-raw(memory:NVMM),width=4000,height=2000" ! rrpanoramaptz ! "video/x-raw,width=500,height=500" ! fakesink | GST_DEBUG="GST_TRACER:7" GST_TRACERS="proctime" gst-launch-1.0 videotestsrc is-live=true num-buffers=200 ! nvvidconv ! queue ! "video/x-raw(memory:NVMM),width=4000,height=2000" ! rrpanoramaptz ! "video/x-raw,width=500,height=500" ! fakesink | ||
</syntaxhighlight> | </syntaxhighlight> | ||
''Resulting Graph:'' | |||
[[File:13-perf.svg|thumbnail|center|640px|Element performance]] | [[File:13-perf.svg|thumbnail|center|640px|Element performance]] | ||
'' | '''4000x2000 input to 1000x1000 output''' | ||
''Pipeline Used:'' | |||
<syntaxhighlight lang=bash> | <syntaxhighlight lang=bash> | ||
GST_DEBUG="GST_TRACER:7" GST_TRACERS="proctime" gst-launch-1.0 videotestsrc is-live=true num-buffers=200 ! nvvidconv ! queue ! "video/x-raw(memory:NVMM),width=4000,height=2000" ! rrpanoramaptz ! "video/x-raw,width=1000,height=1000" ! fakesink | GST_DEBUG="GST_TRACER:7" GST_TRACERS="proctime" gst-launch-1.0 videotestsrc is-live=true num-buffers=200 ! nvvidconv ! queue ! "video/x-raw(memory:NVMM),width=4000,height=2000" ! rrpanoramaptz ! "video/x-raw,width=1000,height=1000" ! fakesink | ||
</syntaxhighlight> | </syntaxhighlight> | ||
''Resulting Graph:'' | |||
[[File:14-perf.svg|thumbnail|center|640px|Element performance]] | [[File:14-perf.svg|thumbnail|center|640px|Element performance]] | ||
==== | '''Summary''' | ||
This table summarizes the average processing time for different resolutions: | |||
{| class="wikitable sortable" style="text-align:center;" | |||
|+ Average processing time for different resolutions | |||
|- | |||
! Resolution (Input – Output) !! Processing Average (ms) | |||
|- | |||
| 2000x1000 – 500x500 || 2.05170 | |||
|- | |||
| 4000x2000 – 500x500 || 3.21540 | |||
|- | |||
| 4000x2000 – 1000x1000 || 3.17019 | |||
|} | |||
====Processing time with ptz transformations using NVMM==== | |||
' | The bash script provided applies PTZ transformations to measure how they impact the processing time of the rrpanoramaptz element. The script sequentially applies a change in the pan position every 0.02 seconds, which introduces additional computational work for the processing element. This is reflected in the measured processing times, providing a realistic understanding of the element's performance under PTZ operations. | ||
<syntaxhighlight lang=bash> | <syntaxhighlight lang="bash" line> | ||
#!/bin/bash | |||
[ | counter=0 | ||
gst-client pipeline_create p1 "videotestsrc is-live=true num-buffers=200 ! nvvidconv ! queue ! video/x-raw(memory:NVMM),width=4000,height=2000 ! rrpanoramaptz name=ptz ! video/x-raw,width=1000,height=1000 ! fakesink" | |||
gst-client pipeline_play p1 | |||
while [ $counter -lt 180 ]; do | |||
gst-client --quiet element_set p1 ptz pan ${counter} | |||
((counter++)) | |||
sleep 0.02 # pan rate of change | |||
done | |||
gst-client pipeline_stop p1 | |||
gst-client pipeline_delete p1 | |||
</syntaxhighlight> | </syntaxhighlight> | ||
'' | ''Resulting Graph:'' | ||
[[File:16-perf.svg|thumbnail|center|640px|Element performance]] | |||
[[File: | |||
''Average processing time: 15.7266 ms''. | |||
The graph shows fluctuations in processing time, which align with the moments when pan transformations are applied by the script. | |||
<noinclude> | <noinclude> | ||
{{Spherical Video PTZ/Foot||Contact_Us}} | {{Spherical Video PTZ/Foot||Contact_Us}} | ||
</noinclude> | </noinclude> | ||
Latest revision as of 15:14, 2 October 2024
| Spherical Video PTZ |
|---|
 |
| Getting Started |
| User Guide |
| Examples |
| Performance |
| Contact Us |

|
Benchmark environment
The measurements are taken considering the following criteria:
- Average behaviour: measurements considering typical image processing pipelines.
Instruments:
- GPU: Jtop
- CPU: RidgeRun Profiler
- RAM: RidgeRun Profiler
- Framerate: GstShark
Engine wrapper
As previously mentioned, the Spherical Video PTZ features an engine wrapper, designed for application development. This section aims to conduct performance measurements using the average value obtained after processing the input image through the 'Process' method of the Spherical Video PTZ engine wrapper. The values presented in the table below are the averages obtained after using the Process method 1000 times. This testing was conducted using the 8 cores of the MODE_30W_ALL mode on a Jetson AGX Xavier with JetPack 5.1.2.
| n | Images type | PTZ used | Input size (px) | Output size (px) | RAM (MiB) | GPU | Avg CPU (%) | Avg processing time (ms) |
|---|---|---|---|---|---|---|---|---|
| 1 | Image | No | 2000x1000 | 500x500 | (phys) 120.00 | (Usage) 1.18 % (VRAM) 6.00 MiB | 10.47 % | 6.845 |
| 2 | Image | No | 4000x2000 | 500x500 | (phys) 171.00 | (Usage) 4.40 % (VRAM) 6.00 MiB | 11.11 % | 14.472 |
| 3 | Image | No | 4000x2000 | 1000x1000 | (phys) 174.00 | (Usage) 5.10 % (VRAM) 7.00 MiB | 10.92 % | 14.738 |
| 4 | Image | Yes | 2000x1000 | 500x500 | (phys) 124.00 | (Usage) 5.14 % (VRAM) 6.00 MiB | 5.64 % | 12.027 |
| 5 | Image | Yes | 4000x2000 | 500x500 | (phys) 179.00 | (Usage) 6.30 % (VRAM) 6.00 MiB | 7.24 % | 22.648 |
| 6 | Image | Yes | 4000x2000 | 1000x1000 | (phys) 183.00 | (Usage) 7.47 % (VRAM) 7.00 MiB | 5.68 % | 30.252 |
| 7 | CudaImage | No | 2000x1000 | 500x500 | (phys) 121.00 | (Usage) 0.02 % (VRAM) 7.00 MiB | 1.73 % | 0.336 |
| 8 | CudaImage | No | 4000x2000 | 500x500 | (phys) 170.00 | (Usage) 0.05 % (VRAM) 10.00 MiB | 1.54 % | 0.352 |
| 9 | CudaImage | No | 4000x2000 | 1000x1000 | (phys) 177.00 | (Usage) 0.10 % (VRAM) 11.00 MiB | 1.55 % | 0.380 |
| 10 | CudaImage | Yes | 2000x1000 | 500x500 | (phys) 119.00 | (Usage) 0.40 % (VRAM) 7.00 MiB | 3.64 % | 5.389 |
| 11 | CudaImage | Yes | 4000x2000 | 500x500 | (phys) 170.00 | (Usage) 0.62 % (VRAM) 10.00 MiB | 3.39 % | 6.812 |
| 12 | CudaImage | Yes | 4000x2000 | 1000x1000 | (phys) 172.00 | (Usage) 5.70 % (VRAM) 11.00 MiB | 2.09 % | 19.471 |
Please consider the following points:
- Image Type: This refers to whether the input and output images use the lp/allocators/cudaimage.hpp library (images allocated in GPU memory) or the lp/image.hpp library (images allocated in CPU memory). In the results, it is evident that processing time is higher when using an Image compared to a CudaImage. This difference arises because although the engine wrapper accepts both types of images, when using an Image, the engine internally creates a copy of the CPU memory to perform operations on the GPU. This copying process consumes considerable time compared to using an image already allocated in GPU memory.
- PTZ Usage: This indicates a change in the pan, tilt, or zoom property before processing the input image. Consequently, the engine wrapper executes an additional step to calculate the output image, leading to an increase in processing time.
Gstreamer element: rrpanoramaptz
Processing time using system memory
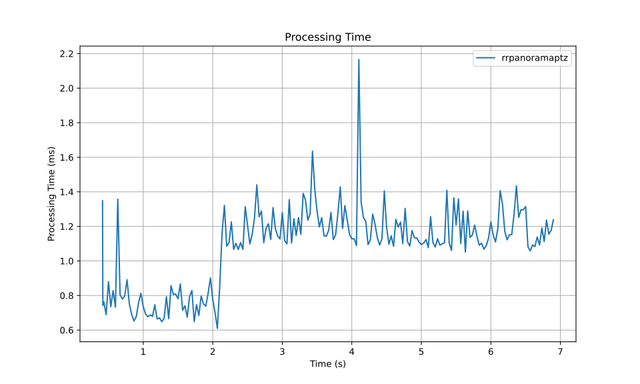
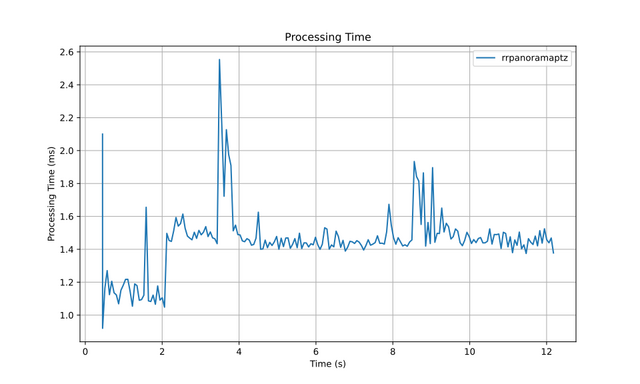
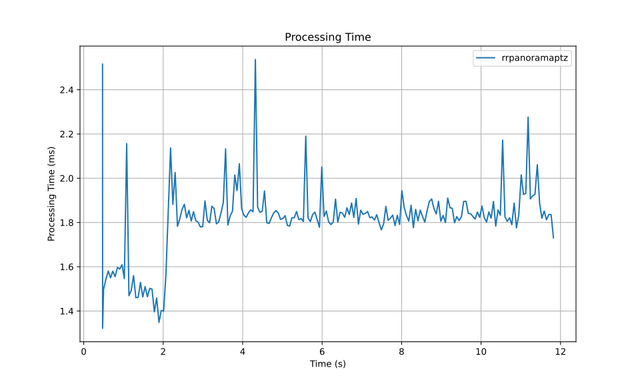
Each of the following sections presents the pipeline used for the performance test and the resulting performance graph, depicting the processing time without PTZ transformations for different video resolutions and output sizes.
2000x1000 input to 500x500 output
Pipeline Used:
GST_DEBUG="GST_TRACER:7" GST_TRACERS="proctime" gst-launch-1.0 videotestsrc is-live=true num-buffers=200 ! queue max-size-buffers=0 max-size-time=0 max-size-bytes=0 ! "video/x-raw,width=2000,height=1000" ! rrpanoramaptz ! "video/x-raw,width=500,height=500" ! fakesink
Resulting Graph:
4000x2000 input to 500x500 output
Pipeline Used:
GST_DEBUG="GST_TRACER:7" GST_TRACERS="proctime" gst-launch-1.0 videotestsrc is-live=true num-buffers=200 ! queue max-size-buffers=0 max-size-time=0 max-size-bytes=0 ! "video/x-raw,width=4000,height=2000" ! rrpanoramaptz ! "video/x-raw,width=500,height=500" ! fakesink
Resulting Graph:
4000x2000 input to 1000x1000 output
Pipeline Used:
GST_DEBUG="GST_TRACER:7" GST_TRACERS="proctime" gst-launch-1.0 videotestsrc is-live=true num-buffers=200 ! queue max-size-buffers=0 max-size-time=0 max-size-bytes=0 ! "video/x-raw,width=4000,height=2000" ! rrpanoramaptz ! "video/x-raw,width=1000,height=1000" ! fakesink
Resulting Graph:
Summary
This table summarizes the average processing time for different resolutions:
| Resolution (Input – Output) | Processing Average (ms) |
|---|---|
| 2000x1000 – 500x500 | 1.08256 |
| 4000x2000 – 500x500 | 1.45138 |
| 4000x2000 – 1000x1000 | 1.81266 |
Processing time with ptz transformations
The bash script provided applies PTZ transformations to measure how they impact the processing time of the rrpanoramaptz element. The script sequentially applies a change in the pan position every 0.02 seconds, which introduces additional computational work for the processing element. This is reflected in the measured processing times, providing a realistic understanding of the element's performance under PTZ operations.
#!/bin/bash

counter=0

gst-client pipeline_create p1 "videotestsrc is-live=true num-buffers=200 ! queue ! video/x-raw,width=4000,height=2000 ! rrpanoramaptz name=ptz ! video/x-raw,width=1000,height=1000 ! fakesink"

gst-client pipeline_play p1

while [ $counter -lt 180 ]; do
    gst-client --quiet element_set p1 ptz pan ${counter}
    ((counter++))
    sleep 0.02 # pan rate of change
done

gst-client pipeline_stop p1
gst-client pipeline_delete p1
Resulting Graph:
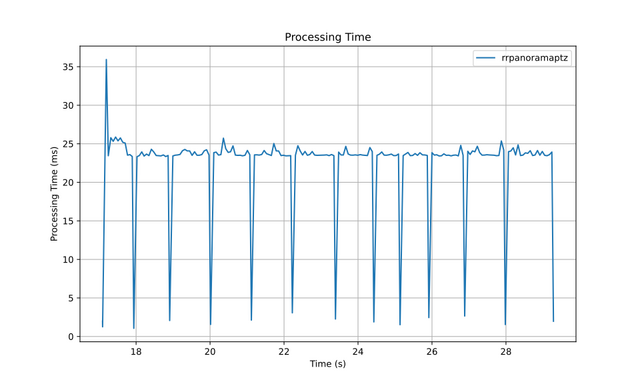
Average processing time: 22.2574 ms.
The graph shows fluctuations in processing time, which align with the moments when pan transformations are applied by the script
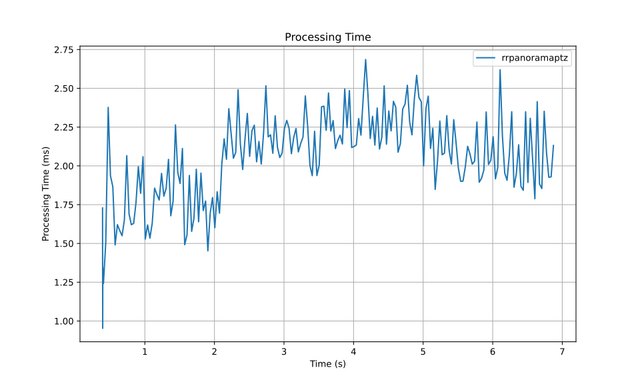
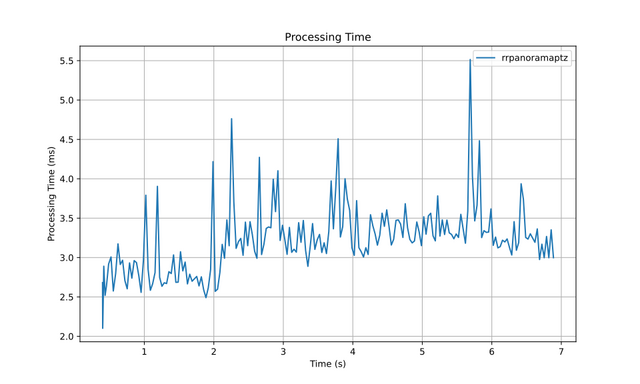
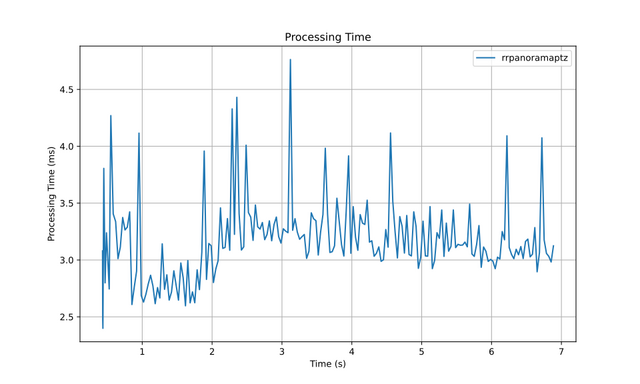
Processing time using NVMM
2000x1000 input to 500x500 output
Pipeline Used:
GST_DEBUG="GST_TRACER:7" GST_TRACERS="proctime" gst-launch-1.0 videotestsrc is-live=true num-buffers=200 ! nvvidconv ! queue ! "video/x-raw(memory:NVMM),width=2000,height=1000" ! rrpanoramaptz ! "video/x-raw,width=500,height=500" ! fakesink
Resulting Graph:
4000x2000 input to 500x500 output
Pipeline Used:
GST_DEBUG="GST_TRACER:7" GST_TRACERS="proctime" gst-launch-1.0 videotestsrc is-live=true num-buffers=200 ! nvvidconv ! queue ! "video/x-raw(memory:NVMM),width=4000,height=2000" ! rrpanoramaptz ! "video/x-raw,width=500,height=500" ! fakesink
Resulting Graph:
4000x2000 input to 1000x1000 output
Pipeline Used:
GST_DEBUG="GST_TRACER:7" GST_TRACERS="proctime" gst-launch-1.0 videotestsrc is-live=true num-buffers=200 ! nvvidconv ! queue ! "video/x-raw(memory:NVMM),width=4000,height=2000" ! rrpanoramaptz ! "video/x-raw,width=1000,height=1000" ! fakesink
Resulting Graph:
Summary
This table summarizes the average processing time for different resolutions:
| Resolution (Input – Output) | Processing Average (ms) |
|---|---|
| 2000x1000 – 500x500 | 2.05170 |
| 4000x2000 – 500x500 | 3.21540 |
| 4000x2000 – 1000x1000 | 3.17019 |
Processing time with ptz transformations using NVMM
The bash script provided applies PTZ transformations to measure how they impact the processing time of the rrpanoramaptz element. The script sequentially applies a change in the pan position every 0.02 seconds, which introduces additional computational work for the processing element. This is reflected in the measured processing times, providing a realistic understanding of the element's performance under PTZ operations.
#!/bin/bash

counter=0

gst-client pipeline_create p1 "videotestsrc is-live=true num-buffers=200 ! nvvidconv ! queue ! video/x-raw(memory:NVMM),width=4000,height=2000 ! rrpanoramaptz name=ptz ! video/x-raw,width=1000,height=1000 ! fakesink"

gst-client pipeline_play p1

while [ $counter -lt 180 ]; do
    gst-client --quiet element_set p1 ptz pan ${counter}
    ((counter++))
    sleep 0.02 # pan rate of change
done

gst-client pipeline_stop p1
gst-client pipeline_delete p1
Resulting Graph:
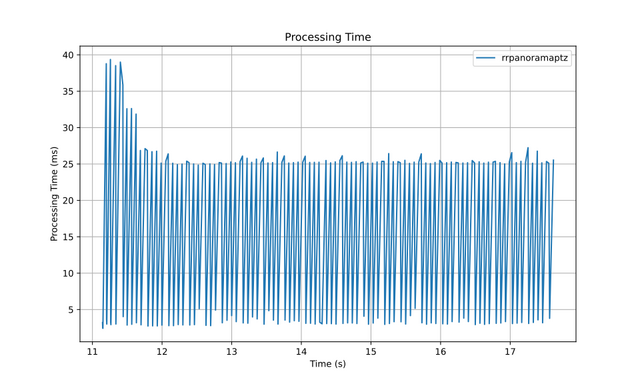
Average processing time: 15.7266 ms.
The graph shows fluctuations in processing time, which align with the moments when pan transformations are applied by the script.
