GStreamer Video Stabilizer for NVIDIA Jetson Boards/Performance/Xavier: Difference between revisions
(Created page with "<noinclude> {{GStreamer Video Stabilizer for NVIDIA Jetson Boards/Head|next=Contact Us}} </noinclude> The following section describes some relevant performance measurements d...") |
mNo edit summary |
||
| (40 intermediate revisions by 4 users not shown) | |||
| Line 1: | Line 1: | ||
<noinclude> | <noinclude> | ||
{{GStreamer Video Stabilizer for NVIDIA Jetson Boards/Head|next=Contact Us}} | {{GStreamer Video Stabilizer for NVIDIA Jetson Boards/Head|previous=Performance/TX1/TX2|next=Contact Us|metakeywords=TX1/TX2_pipelines performance, Xavier pipelines performance, examples, performance analysis, GstNvStabilize performance, GstNvStabilize performance analysis, Xavier performance, CPU performance, GPU performance}} | ||
</noinclude> | </noinclude> | ||
The following section describes some relevant performance measurements during video stabilization. | The following section describes some relevant performance measurements during video stabilization for a few standard resolutions. It begins with a summary of the results detailed in the following sections, as well as the pipelines used to capture such results. | ||
__TOC__ | __TOC__ | ||
= | = Summary = | ||
{| class="wikitable" | == Benchmarking == | ||
=== Standalone element === | |||
==== Test Conditions ==== | |||
All the measurements below were made using the following minimal pipeline. | |||
<syntaxhighlight lang=bash> | |||
PATH_TO_FILE=path_to_file.rgba | |||
WIDTH=1920 | |||
HEIGHT=1080 | |||
FRAME_SIZE=$(($WIDTH * $HEIGHT * 4)) | |||
gst-launch-1.0 filesrc location=$PATH_TO_FILE blocksize=$FRAME_SIZE ! videoparse format=rgba width=$WIDTH height=$HEIGHT ! nvstabilize ! fakesink sync=true | |||
</syntaxhighlight> | |||
Note that this pipeline attempts to be as the least invasive as possible so the only processing element is GstNvStabilize. | |||
==== Maximum and minimum framerate ==== | |||
These measurements were taken with the pipeline above, but without any limitation regarding the framerate. In the next table, you can find the maximum, minimum, and average framerate for video input and different resolution stabilized by the plugin. | |||
{| class="wikitable" style="margin: 1em auto 1em auto" | |||
|- | |- | ||
! | ! Resolution !! Maximum framerate !! Minimum framerate !! Average | ||
|- | |- | ||
| | | 640x480 || 220.77 || 182.53 || 204.0 | ||
|- | |||
| 1280x720 || 141.57 || 119.88 || 129.87 | |||
|- | |||
| 1920x1080 || 91.36 || 60.69 || 79.20 | |||
|- | |||
| 3840×2160 || 31.96 || 17.17 || 25.12 | |||
|} | |} | ||
<span style="color:red"> '''Note:''' To take into account the framerate relies on the movement of the video. </span> | |||
[[File:Max-min-framerate-xavier.png|frame|center|Maximum and minimum framerate for different resolutions.]] | |||
= | |||
{| class="wikitable" | ==== CPU ==== | ||
{| class="wikitable" style="margin: 1em auto 1em auto" | |||
|- | |||
! Resolution !! CPU 0 !! CPU 1 !! CPU 2 !! CPU 3 !! Average (reported by top) | |||
|- | |||
| 640x480@25Fps || 23.6 || 2.9 || 0.7 || 0 || 22.7 | |||
|- | |||
| 1280x720@25Fps || 27.55 || 12.33 || 0 || 1.44 ||27.3 | |||
|- | |||
| 1920x1080@25Fps || 42.05 || 1.44 || 1.27 || 4.055 || 41.5 | |||
|- | |||
| 2048×1080@25Fps || 51.17 || 3.73 || 2.70 || 0.20 || 49.2 | |||
|} | |||
[[File:Cpu xav.png|frame|center|CPU consumption for different resolutions.]] | |||
==== GPU ==== | |||
{| class="wikitable" style="margin: 1em auto 1em auto" | |||
|- | |||
! Resolution !! GPU | |||
|- | |||
| 640x480@25Fps ||1.41 | |||
|- | |||
| 1280x720@25Fps || 2.53 | |||
|- | |||
| 1920x1080@25Fps || 3.87 | |||
|- | |||
| 2048×1080@25Fps || 4.6 | |||
|} | |||
[[File:Gpu xav.png|frame|center|GPU consumption for different resolutions.]] | |||
==== RAM ==== | |||
{| class="wikitable" style="margin: 1em auto 1em auto" | |||
|- | |||
! Resolution !! RAM | |||
|- | |||
| 640x480@25Fps || 2136/15828MB | |||
|- | |||
| 1280x720@25Fps || 2153/15828MB | |||
|- | |||
| 1920x1080@25Fps || 2528/15828MB | |||
|- | |||
| 2048×1080@25Fps || 2572/15828MB | |||
|} | |||
[[File:Ram xav.png|frame|center|RAM consumption for different resolutions.]] | |||
== Full pipeline == | |||
The following measurements were taken using an OV10635 camera at '''1280x720@30FPS'''. As further explained on the [https://developer.ridgerun.com/wiki/index.php?title=GStreamer_Video_Stabilizer_for_NVIDIA_Jetson_Boards/User_Guide User Guide], the resulting stabilization, latency and resources the element consumes are all affected by the chosen queue-size, as shown in the results reported as follows: | |||
<pre> | |||
gst-launch-1.0 v4l2src device=/dev/video0 ! 'video/x-raw,width=1280,height=720' ! nvvidconv ! 'video/x-raw(memory:NVMM),width=1280,height=720,format=RGBA' ! nvvidconv ! queue max-size-buffers=1 leaky=downstream ! nvstabilize queue-size=5 ! fakesink | |||
</pre> | |||
{| class="wikitable" style="margin: 1em auto 1em auto" | |||
|- | |||
! Queue-size !! RAM !! CPU 0 !! CPU 1 !! CPU 2 !! CPU 3 !! GPU !! Framerate | |||
|- | |||
| No stabilization || 1384/15828MB || 18.875 || 8.625 || 11 || 0.75 || 2.125 || 30 | |||
|- | |||
| 1|| 1396/15828MB || 31.11 || 29 || 1.55 || 3.22 || 10.33 || 30 | |||
|- | |||
| 2 || 1406/15828MB || 23.625 || 22.75 || 9.125 || 9 || 13.125 || 30 | |||
|- | |||
| 3 || 1426/15828MB || 17.625 || 20.375 || 11.75 || 12.75 || 15.25 || 30 | |||
|- | |||
| 4 || 1441/15828MB || 16.42 || 20.71 || 14.85 || 14.28 || 8.57 || 30 | |||
|- | |||
| 5 || 1551/15828MB || 10 || 11.7 || 23 || 11.7 || 7.8 || 30 | |||
|- | |||
| 6 || 1563/15828MB || 14.77 || 13.77 || 21.11 || 11.77 || 10 || 30 | |||
|} | |||
== Glass-to-glass latency == | |||
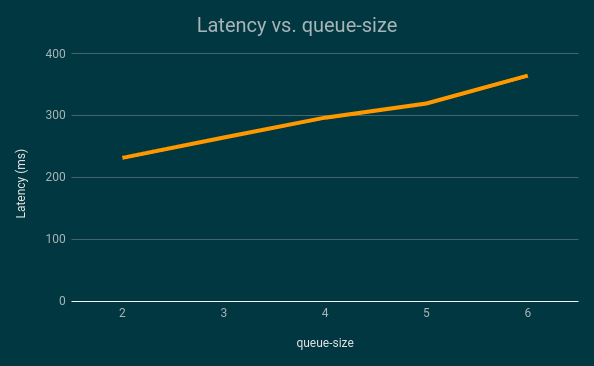
Latency was measured as shown in the picture, and the following are the approximate results. It is important to notice that latency can be affected by the parameters selected on the pipeline, specifically the queue-size property of the gst-nvstabilize element, as further explained on the [https://developer.ridgerun.com/wiki/index.php?title=GStreamer_Video_Stabilizer_for_NVIDIA_Jetson_Boards/User_Guide User Guide]. The pipeline used was the following: | |||
'''Note:''' the following latency measurements were '''NOT''' taken with high-performance enabled, given that the chosen resolution did not require it. | |||
<syntaxhighlight lang=bash> | |||
gst-launch-1.0 v4l2src device=/dev/video0 ! 'video/x-raw,width=1280,height=720' ! nvvidconv ! 'video/x-raw(memory:NVMM),width=1280,height=720,format=RGBA' ! nvvidconv ! queue max-size-buffers=1 leaky=downstream ! nvstabilize queue-size=5 ! nvvidconv ! nvoverlaysink sync=false | |||
</syntaxhighlight> | |||
[[File:Photo5174730964096624673.jpg| 800x411px| frame thumb |center|Glass-to-glass latency measurement]] | |||
''' 1280x720@30Fps ''' | |||
{| class="wikitable" style="margin: 1em auto 1em auto" | |||
|- | |||
! queue-size !! Latency (ms) | |||
|- | |||
| No stabilizer || 132 | |||
|- | |||
| 1 || 199 | |||
|- | |||
| 2 || 232 | |||
|- | |- | ||
| 3 || 265 | |||
|- | |- | ||
| 4 || 297 | |||
|- | |- | ||
| | | 5 || 320 | ||
|- | |- | ||
| 6 || 365 | |||
|} | |} | ||
[[File:Lat xav.png|frame|center|Latency measurements varying queue size.]] | |||
<noinclude> | <noinclude> | ||
{{GStreamer Video Stabilizer for NVIDIA Jetson Boards/Foot||Contact Us}} | {{GStreamer Video Stabilizer for NVIDIA Jetson Boards/Foot|Performance/TX1/TX2|Contact Us}} | ||
</noinclude> | </noinclude> | ||
Latest revision as of 11:13, 27 February 2023
| GStreamer Video Stabilizer |
|---|
| Video Stabilization Basics |
| User Guide |
| Getting Started |
| Examples |
| Performance |
| Contact Us |
The following section describes some relevant performance measurements during video stabilization for a few standard resolutions. It begins with a summary of the results detailed in the following sections, as well as the pipelines used to capture such results.
Summary
Benchmarking
Standalone element
Test Conditions
All the measurements below were made using the following minimal pipeline.
PATH_TO_FILE=path_to_file.rgba
WIDTH=1920
HEIGHT=1080
FRAME_SIZE=$(($WIDTH * $HEIGHT * 4))

gst-launch-1.0  filesrc location=$PATH_TO_FILE blocksize=$FRAME_SIZE ! videoparse format=rgba width=$WIDTH height=$HEIGHT ! nvstabilize ! fakesink sync=true
Note that this pipeline attempts to be as the least invasive as possible so the only processing element is GstNvStabilize.
Maximum and minimum framerate
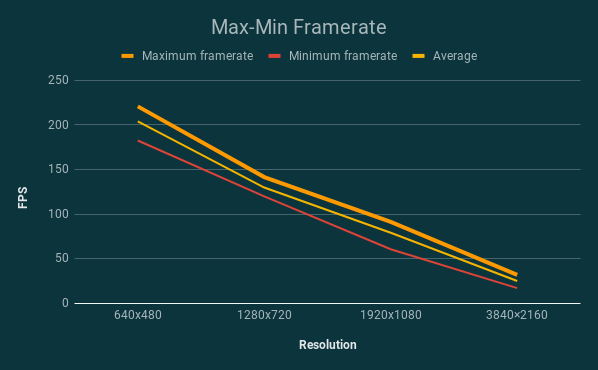
These measurements were taken with the pipeline above, but without any limitation regarding the framerate. In the next table, you can find the maximum, minimum, and average framerate for video input and different resolution stabilized by the plugin.
| Resolution | Maximum framerate | Minimum framerate | Average |
|---|---|---|---|
| 640x480 | 220.77 | 182.53 | 204.0 |
| 1280x720 | 141.57 | 119.88 | 129.87 |
| 1920x1080 | 91.36 | 60.69 | 79.20 |
| 3840×2160 | 31.96 | 17.17 | 25.12 |
Note: To take into account the framerate relies on the movement of the video.
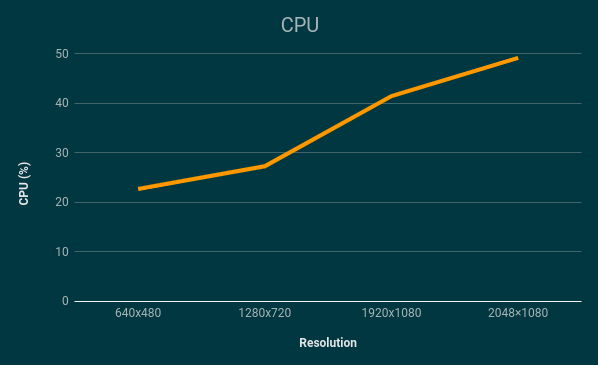
CPU
| Resolution | CPU 0 | CPU 1 | CPU 2 | CPU 3 | Average (reported by top) |
|---|---|---|---|---|---|
| 640x480@25Fps | 23.6 | 2.9 | 0.7 | 0 | 22.7 |
| 1280x720@25Fps | 27.55 | 12.33 | 0 | 1.44 | 27.3 |
| 1920x1080@25Fps | 42.05 | 1.44 | 1.27 | 4.055 | 41.5 |
| 2048×1080@25Fps | 51.17 | 3.73 | 2.70 | 0.20 | 49.2 |
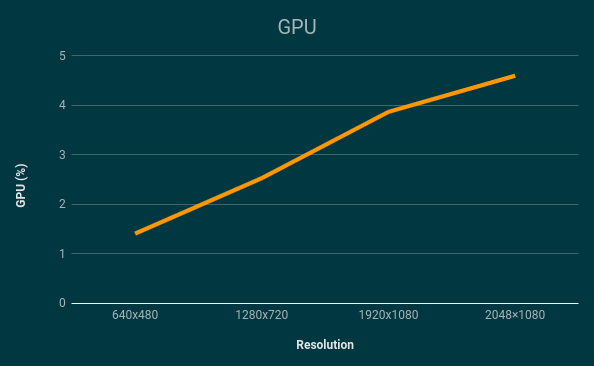
GPU
| Resolution | GPU |
|---|---|
| 640x480@25Fps | 1.41 |
| 1280x720@25Fps | 2.53 |
| 1920x1080@25Fps | 3.87 |
| 2048×1080@25Fps | 4.6 |
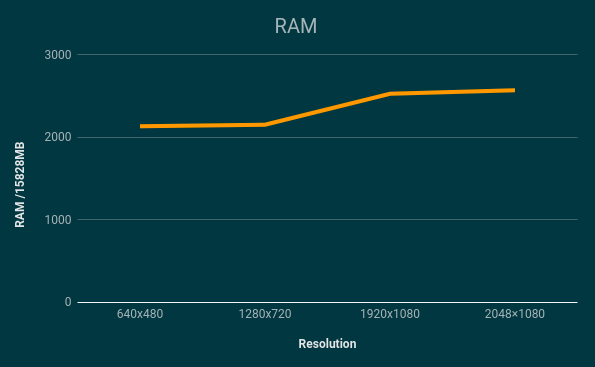
RAM
| Resolution | RAM |
|---|---|
| 640x480@25Fps | 2136/15828MB |
| 1280x720@25Fps | 2153/15828MB |
| 1920x1080@25Fps | 2528/15828MB |
| 2048×1080@25Fps | 2572/15828MB |
Full pipeline
The following measurements were taken using an OV10635 camera at 1280x720@30FPS. As further explained on the User Guide, the resulting stabilization, latency and resources the element consumes are all affected by the chosen queue-size, as shown in the results reported as follows:
gst-launch-1.0 v4l2src device=/dev/video0 ! 'video/x-raw,width=1280,height=720' ! nvvidconv ! 'video/x-raw(memory:NVMM),width=1280,height=720,format=RGBA' ! nvvidconv ! queue max-size-buffers=1 leaky=downstream ! nvstabilize queue-size=5 ! fakesink
| Queue-size | RAM | CPU 0 | CPU 1 | CPU 2 | CPU 3 | GPU | Framerate |
|---|---|---|---|---|---|---|---|
| No stabilization | 1384/15828MB | 18.875 | 8.625 | 11 | 0.75 | 2.125 | 30 |
| 1 | 1396/15828MB | 31.11 | 29 | 1.55 | 3.22 | 10.33 | 30 |
| 2 | 1406/15828MB | 23.625 | 22.75 | 9.125 | 9 | 13.125 | 30 |
| 3 | 1426/15828MB | 17.625 | 20.375 | 11.75 | 12.75 | 15.25 | 30 |
| 4 | 1441/15828MB | 16.42 | 20.71 | 14.85 | 14.28 | 8.57 | 30 |
| 5 | 1551/15828MB | 10 | 11.7 | 23 | 11.7 | 7.8 | 30 |
| 6 | 1563/15828MB | 14.77 | 13.77 | 21.11 | 11.77 | 10 | 30 |
Glass-to-glass latency
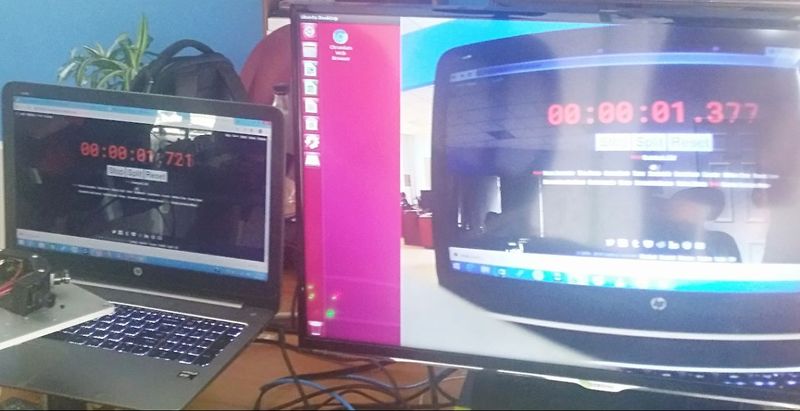
Latency was measured as shown in the picture, and the following are the approximate results. It is important to notice that latency can be affected by the parameters selected on the pipeline, specifically the queue-size property of the gst-nvstabilize element, as further explained on the User Guide. The pipeline used was the following:
Note: the following latency measurements were NOT taken with high-performance enabled, given that the chosen resolution did not require it.
gst-launch-1.0 v4l2src device=/dev/video0 ! 'video/x-raw,width=1280,height=720' ! nvvidconv ! 'video/x-raw(memory:NVMM),width=1280,height=720,format=RGBA' ! nvvidconv ! queue max-size-buffers=1 leaky=downstream ! nvstabilize queue-size=5 ! nvvidconv ! nvoverlaysink sync=false
1280x720@30Fps
| queue-size | Latency (ms) |
|---|---|
| No stabilizer | 132 |
| 1 | 199 |
| 2 | 232 |
| 3 | 265 |
| 4 | 297 |
| 5 | 320 |
| 6 | 365 |
