GStreamer Based Image Signal Processor/Performance/imx8: Difference between revisions
Acervantes (talk | contribs) |
No edit summary |
||
| (43 intermediate revisions by 4 users not shown) | |||
| Line 1: | Line 1: | ||
<noinclude> | <noinclude> | ||
{{GStreamer Based Image Signal Processor/Head|previous=Performance/imx6|next= | {{GStreamer Based Image Signal Processor/Head|previous=Performance/imx6|next=Performance/rb5|metakeywords=CSC Benchmarking, CPU usage, Memory usage, Execution time, Maximum Framerate, Debayer Benchmarking, Histogram Equalization Benchmarking, AWB Benchmarking}} | ||
</noinclude> | </noinclude> | ||
== Benchmark environment == | |||
The following setup was used for all the benchmarks: | |||
*[https://www.nxp.com/design/development-boards/i.mx-evaluation-and-development-boards/evaluation-kit-for-the-i.mx-8m-applications-processor:MCIMX8M-EVK NXP® i.MX 8MQuad Evaluation Kit (EVK)] | |||
*Yocto built image (fsl-image-multimedia) from Freescale BSP | |||
*i.MX8 5640 RAW10 Camera Module | |||
== Pipeline == | === GStreamer Bayer10 Support === | ||
GStreamer has support for 8-bit Bayer only. To enable 10-bit Bayer support, please, follow this | |||
[[CUDA_ISP_for_NVIDIA_Jetson/Getting_Started/Building_custom_v4l2src_element|wiki]]. | |||
=== Performance in other i.MX 8 boards === | |||
According to the product comparison [https://www.variscite.com/wp-content/uploads/2020/11/i.MX8_SoC_Comparion_Chart.pdf available here]: | |||
{| class="wikitable" | |||
|- style="font-weight:bold;" | |||
! Family | |||
! Subfamilies | |||
! GPU | |||
! Number of Shaders | |||
! Supported by GstISP | |||
|- | |||
| i.MX 8 | |||
| QM, QP<br /> | |||
| 2x GC7000XSVX | |||
| 8 shader/each | |||
| Yes | |||
|- | |||
| i.MX 8X | |||
| QXP, DXP, DX | |||
| 1x GC7000Lite | |||
| 4 shaders | |||
| Yes | |||
|- style="background-color:#fe996b;" | |||
| i.MX 8M | |||
| Q, D, QL<br /> | |||
| 1x GC7000Lite | |||
| 4 shaders | |||
| Yes | |||
|- | |||
| i.MX 8M Mini | |||
| QL, DL, SL, Q, D, S | |||
| 1x GCNanoUltra | |||
| 1 shader | |||
| No (No OpenCL supported) | |||
|- | |||
| i.MX 8M Nano | |||
| QL, DL, SL, Q, D, S | |||
| (Q, D, S) 1x GC7000UltraLite<br />(QL, DL, SL) No graphics<br /> | |||
| 2 shaders | |||
| Yes in Q, D, S<br /> | |||
|- | |||
| i.MX 8M Plus | |||
| Q, QL, D | |||
| 1x GC7000UltraLite | |||
| 2 shaders | |||
| Yes | |||
|} | |||
For the measurements, we are using the i.MX 8M Quad (Q), equipped with a GPU GC7000 Lite with 4 shaders. GPUs with fewer shaders may lead to lower performance. We have observed that the <code>ispcldebayer</code> (Debayer) at 1080p works at ~22 fps in an i.MX 8MP is equipped with a GPU with only 2 shaders. | |||
If you are interested in optimisation and achieving higher performance, you can message us at [http://mailto:support@ridgerun.com support@ridgerun.com], and we will be glad to team up with you on your project. | |||
== CSC Benchmarking == | |||
The following section describes some relevant performance measurements for the RGBA to NV12 color space conversion for a few standard resolutions. It begins with a summary of the results detailed in the following sections, as well as the pipelines used to capture such results. | |||
=== Pipeline === | |||
All the measurements below were made using the following minimal pipeline. | All the measurements below were made using the following minimal pipeline. | ||
| Line 19: | Line 84: | ||
</syntaxhighlight> | </syntaxhighlight> | ||
== Summary == | === Summary === | ||
In this summary you can find measurements related with CPU usage, memory, execution time and maximum framerate supported by the CSC algorithm. | In this summary you can find measurements related with CPU usage, memory, execution time and maximum framerate supported by the CSC algorithm. | ||
<html> | <html> | ||
| Line 26: | Line 91: | ||
<tr> | <tr> | ||
<th>Resolution</th> | <th>Resolution</th> | ||
<th>CPU usage (%) | <th>CPU usage (%)</th> | ||
<th>Memory ( | <th>Memory Bandwidth (GHz)</th> | ||
<th>Execution Time (ms)</th> | <th>Execution Time (ms)</th> | ||
</tr> | </tr> | ||
| Line 33: | Line 98: | ||
<td>640x480@30fps</td> | <td>640x480@30fps</td> | ||
<td>4</td> | <td>4</td> | ||
<td> | <td>1.020</td> | ||
<td>2.24</td> | <td>2.24</td> | ||
</tr> | </tr> | ||
| Line 39: | Line 104: | ||
<td>1280x720@30fps</td> | <td>1280x720@30fps</td> | ||
<td>10</td> | <td>10</td> | ||
<td> | <td>1.034</td> | ||
<td>6.19</td> | <td>6.19</td> | ||
</tr> | </tr> | ||
| Line 45: | Line 110: | ||
<td>1920x1080@30fps</td> | <td>1920x1080@30fps</td> | ||
<td>14</td> | <td>14</td> | ||
<td> | <td>1.466</td> | ||
<td>13.17</td> | <td>13.17</td> | ||
</tr> | </tr> | ||
<caption>Table 1. | <caption>Table 1. Performance for several standard resolutions at 30fps</caption> | ||
</table> | </table> | ||
</center> | </center> | ||
</html> | </html> | ||
<html> | <html> | ||
| Line 62: | Line 123: | ||
<tr> | <tr> | ||
<th>Resolution</th> | <th>Resolution</th> | ||
<th>Maximum framerate (fps)</th> | <th>Maximum framerate (fps) *</th> | ||
</tr> | </tr> | ||
<tr> | <tr> | ||
| Line 76: | Line 137: | ||
<td>55</td> | <td>55</td> | ||
</tr> | </tr> | ||
<caption>Table 2. | <caption>Table 2. Maximum framerate at standard resolutions</caption> | ||
</table> | </table> | ||
</center> | </center> | ||
</html> | </html> | ||
==CPU usage== | <br> | ||
These measurements were taken with '''top''' app to monitor the behavior of the pipeline while running. | {{Ambox | ||
[[File:Cpu.png|frame|center|CPU usage for CSC | |type=notice | ||
|small=left | |||
|issue='''Note:''' take into consideration that these values were taken using the videotestsrc element, and may decrease with a camera source capture. | |||
|style=width:unset; | |||
}} | |||
<br> | |||
===CPU usage=== | |||
These measurements were taken with the '''top''' app to monitor the behavior of the pipeline while running. | |||
[[File:Cpu.png|frame|center|CPU usage for '''CSC''' element]] | |||
===Memory usage=== | |||
These measurements were taken with '''perf stat''' Linux tool to measure the bandwidth needed by the pipeline. | |||
[[File:Memo.png|frame|center|Memory bandwidth consumption by '''CSC''' element]] | |||
== | ===Execution time=== | ||
These measurements were taken | These measurements were taken using some '''timestamps''' before and after the processing to measure just the execution time for the kernel algorithm on each frame and hence avoiding possible false measurements from the GStreamer plugin. | ||
[[File:Extime.png|frame|center|Execution time for different resolutions with the '''CSC''' element]] | |||
[[File:Extime.png|frame|center|Execution time for different resolutions | |||
==Maximum Framerate== | ===Maximum Framerate=== | ||
These measurements were taken with the '''gst-perf''' tool to monitor the behavior of the pipeline while running. When using videotestsrc we are able to process as many buffers as the element can handle, hence the maximum value reported | These measurements were taken with the '''gst-perf''' tool to monitor the behavior of the pipeline while running. When using videotestsrc we are able to process as many buffers as the element can handle, hence the maximum value reported. | ||
The following pipeline was used to test the maximum framerate, please note the use of videotestsrc. | The following pipeline was used to test the maximum framerate, please note the use of videotestsrc. | ||
| Line 104: | Line 177: | ||
</syntaxhighlight> | </syntaxhighlight> | ||
[[File:Framerate.png|frame|center|Framerate for different resolutions | [[File:Framerate.png|frame|center|Framerate for different resolutions with the '''CSC''' element]] | ||
=Debayer Benckmarking= | ==Debayer Benckmarking== | ||
The following section describes some relevant performance measurements during debayering for a few standard resolutions. It begins with a summary of the results detailed on the following sections, as well as the pipelines used to capture such results. | The following section describes some relevant performance measurements during debayering for a few standard resolutions. It begins with a summary of the results detailed on the following sections, as well as the pipelines used to capture such results. | ||
== Pipeline == | === Pipeline === | ||
All the measurements below were made using the following minimal pipeline. | All the measurements below were made using the following minimal pipeline. | ||
| Line 118: | Line 191: | ||
HEIGHT=1080 | HEIGHT=1080 | ||
gst-launch-1.0 v4l2src | $ gst-launch-1.0 v4l2src device=/dev/video0 ! video/x-bayer,format=bggr,bpp=10,width=$WIDTH,height=$HEIGHT,framerate=30/1 ! ispclbayer10to8 ! queue ! ispcldebayer ! fakesink -v | ||
</syntaxhighlight> | </syntaxhighlight> | ||
== Summary == | === Summary === | ||
In this summary you can find measurements related with CPU usage, memory, execution time and maximum framerate supported by the debayer algorithm. | In this summary you can find measurements related with CPU usage, memory, execution time and maximum framerate supported by the debayer algorithm. | ||
<html> | <html> | ||
| Line 128: | Line 201: | ||
<tr> | <tr> | ||
<th>Resolution</th> | <th>Resolution</th> | ||
<th>CPU usage (%) | <th>CPU usage (%)</th> | ||
<th>Memory ( | <th>Memory Bandwidth (GHz)</th> | ||
<th>Execution Time (ms)</th> | <th>Execution Time (ms)</th> | ||
</tr> | </tr> | ||
| Line 135: | Line 208: | ||
<td>640x480@30fps</td> | <td>640x480@30fps</td> | ||
<td>2</td> | <td>2</td> | ||
<td> | <td>1.025</td> | ||
<td>3.54</td> | <td>3.54</td> | ||
</tr> | </tr> | ||
| Line 141: | Line 214: | ||
<td>1280x720@30fps</td> | <td>1280x720@30fps</td> | ||
<td>2</td> | <td>2</td> | ||
<td> | <td>1.084</td> | ||
<td>9.89</td> | <td>9.89</td> | ||
</tr> | </tr> | ||
| Line 147: | Line 220: | ||
<td>1920x1080@30fps</td> | <td>1920x1080@30fps</td> | ||
<td>3</td> | <td>3</td> | ||
<td> | <td>1.402</td> | ||
<td>21.46</td> | <td>21.46</td> | ||
</tr> | </tr> | ||
<caption>Table 1. | <caption>Table 1. Performance for several standard resolutions at 30fps</caption> | ||
</table> | </table> | ||
</center> | </center> | ||
| Line 161: | Line 234: | ||
<tr> | <tr> | ||
<th>Resolution</th> | <th>Resolution</th> | ||
<th>Maximum framerate (fps)</th> | <th>Maximum framerate (fps)*</th> | ||
</tr> | </tr> | ||
<tr> | <tr> | ||
| Line 175: | Line 248: | ||
<td>46</td> | <td>46</td> | ||
</tr> | </tr> | ||
<caption>Table 2. | <caption>Table 2. Maximum framerate at standard resolutions</caption> | ||
</table> | </table> | ||
</center> | </center> | ||
</html> | </html> | ||
== | <br> | ||
{{Ambox | |||
|type=notice | |||
|small=left | |||
|issue='''Note:''' take into consideration that these values were taken using the videotestsrc element, and may decrease with a camera source capture. | |||
|style=width:unset; | |||
}} | |||
<br> | |||
===CPU usage=== | |||
These measurements were taken with the '''top''' app to monitor the behavior of the pipeline while running. | |||
[[File:cpu-usage-debayer.png|frame|center|CPU usage for '''debayer''' element]] | |||
===Memory usage=== | |||
These measurements were taken with '''perf stat''' linux tool to measure the bandwidth needed by the pipeline. | |||
[[File:memory-debayer.png|frame|center|Memory bandwidth consumption by '''debayer''' element]] | |||
==Execution time== | ===Execution time=== | ||
These measurements were taken | These measurements were taken using some '''timestamps''' before and after the processing to measure just the execution time for the kernel algorithm on each frame and hence avoiding possible false measurements from the GStreamer plugin. | ||
[[File:exec-time-debayer.png|frame|center|Execution time | [[File:exec-time-debayer.png|frame|center|Execution time for different resolutions with the '''debayer''' element]] | ||
==Maximum Framerate== | ===Maximum Framerate=== | ||
These measurements were taken with ''' | These measurements were taken with the '''gst-perf''' tool to monitor the behavior of the pipeline while running. When using videotestsrc we are able to process as many buffers as the element can handle, hence the maximum value reported. | ||
The following pipeline was used to test the maximum framerate, please note the use of videotestsrc. | The following pipeline was used to test the maximum framerate, please note the use of videotestsrc. | ||
| Line 206: | Line 287: | ||
$ HEIGHT=1080 | $ HEIGHT=1080 | ||
$ gst-launch-1.0 videotestsrc ! "video/x- | $ gst-launch-1.0 videotestsrc ! "video/x-bayer,format=bggr,width=$WIDTH,height=$HEIGHT,framerate=30/1" ! queue ! ispcldebayer ! perf ! fakesink -v | ||
</syntaxhighlight> | |||
[[File:max-framerate-debayer.png|frame|center|Framerate for different resolutions with the '''debayer''' element]] | |||
== AWB Benchmarking == | |||
The following section describes some relevant performance measurements for the auto-white balance for a few standard resolutions. It begins with a summary of the results detailed on the following sections, as well as the pipelines used to capture such results. | |||
=== Pipeline === | |||
All the measurements below were made using the following minimal pipeline. | |||
<syntaxhighlight lang=bash style="background-color: #f0fff0"> | |||
$ WIDTH=1920 | |||
$ HEIGHT=1080 | |||
$ gst-launch-1.0 v4l2src device=/dev/video0 ! video/x-bayer,format=bggr,bpp=10,width=$WIDTH,height=$HEIGHT,framerate=30/1 ! ispclbayer10to8 ! queue ! ispclawb ! fakesink -v | |||
</syntaxhighlight> | |||
=== Summary === | |||
In this summary you can find measurements related with CPU usage, memory, execution time and maximum framerate supported by the auto-white balance algorithm. | |||
<html> | |||
<center> | |||
<table class="wikitable" style="color:black;"> | |||
<tr> | |||
<th>Resolution</th> | |||
<th>CPU usage (%)</th> | |||
<th>Memory Bandwidth (GHz)</th> | |||
<th>Execution Time (ms)</th> | |||
</tr> | |||
<tr> | |||
<td>640x480@30fps</td> | |||
<td> 10 </td> | |||
<td> 0.994 </td> | |||
<td>3.11</td> | |||
</tr> | |||
<tr> | |||
<td>1280x720@30fps</td> | |||
<td> 12 </td> | |||
<td> 1.032 </td> | |||
<td>4.54</td> | |||
</tr> | |||
<tr> | |||
<td>1920x1080@30fps</td> | |||
<td> 16 </td> | |||
<td> 1.239 </td> | |||
<td>8.52</td> | |||
</tr> | |||
<caption>Table 1. Performance for several standard resolutions at 30fps</caption> | |||
</table> | |||
</center> | |||
</html> | |||
<html> | |||
<center> | |||
<table class="wikitable" style="color:black;"> | |||
<tr> | |||
<th>Resolution</th> | |||
<th>Maximum framerate (fps) *</th> | |||
</tr> | |||
<tr> | |||
<td>640x480</td> | |||
<td> 365 </td> | |||
</tr> | |||
<tr> | |||
<td>1280x720</td> | |||
<td> 135 </td> | |||
</tr> | |||
<tr> | |||
<td>1920x1080</td> | |||
<td> 62 </td> | |||
</tr> | |||
<caption>Table 2. Maximum framerate at standard resolutions</caption> | |||
</table> | |||
</center> | |||
</html> | |||
<br> | |||
{{Ambox | |||
|type=notice | |||
|small=left | |||
|issue='''Note:''' take into consideration that these values were taken using the videotestsrc element, and may decrease with a camera source capture. | |||
|style=width:unset; | |||
}} | |||
<br> | |||
===CPU usage=== | |||
These measurements were taken with the '''top''' app to monitor the behavior of the pipeline while running. | |||
[[File:CPU usage for AWB.png|frame|center|CPU usage for '''AWB''' element]] | |||
===Memory usage=== | |||
These measurements were taken with '''perf stat''' linux tool to measure the bandwidth needed by the pipeline. | |||
[[File:Memory Bandwidth for AWB.png|frame|center|Memory bandwidth consumption by '''AWB''' element]] | |||
===Execution time=== | |||
These measurements were taken using some '''timestamps''' before and after the processing to measure just the execution time for the kernel algorithm on each frame and hence avoiding possible false measurements from the GStreamer plugin. | |||
[[File:Execution Time AWB.png|frame|center|Execution time for different resolutions with the '''AWB''' element]] | |||
===Maximum Framerate=== | |||
These measurements were taken with the '''gst-perf''' tool to monitor the behavior of the pipeline while running. When using videotestsrc we are able to process as many buffers as the element can handle, hence the maximum value reported. | |||
The following pipeline was used to test the maximum framerate, please note the use of videotestsrc. | |||
<syntaxhighlight lang=bash style="background-color: #f0fff0"> | |||
$ WIDTH=1920 | |||
$ HEIGHT=1080 | |||
$ gst-launch-1.0 videotestsrc ! "video/x-bayer,format=bggr,width=$WIDTH,height=$HEIGHT,framerate=30/1" ! queue ! ispclawb ! perf ! fakesink -v | |||
</syntaxhighlight> | |||
[[File:Maximum Framerate AWB.png|frame|center|Framerate for different resolutions with the '''AWB''' element]] | |||
== Histogram Equalization Benchmarking == | |||
The following section describes some relevant performance measurements for the Histogram Equalization for a few standard resolutions. It begins with a summary of the results detailed on the following sections, as well as the pipelines used to capture such results. | |||
=== Pipeline === | |||
All the measurements below were made using the following minimal pipeline. | |||
<syntaxhighlight lang=bash style="background-color: #f0fff0"> | |||
$ WIDTH=1920 | |||
$ HEIGHT=1080 | |||
$ gst-launch-1.0 v4l2src device=/dev/video0 ! video/x-bayer,format=bggr,bpp=10,width=$WIDTH,height=$HEIGHT,framerate=30/1 ! ispclbayer10to8 ! queue ! ispcleq ! fakesink -v | |||
</syntaxhighlight> | |||
=== Summary === | |||
In this summary you can find measurements related with CPU usage, memory, execution time and maximum framerate supported by the Histogram Equalization algorithm. | |||
<html> | |||
<center> | |||
<table class="wikitable" style="color:black;"> | |||
<tr> | |||
<th>Resolution</th> | |||
<th>CPU usage (%)</th> | |||
<th>Memory Bandwidth (GHz)</th> | |||
<th>Execution Time (ms)</th> | |||
</tr> | |||
<tr> | |||
<td>640x480@30fps</td> | |||
<td> 10 </td> | |||
<td> 0.990 </td> | |||
<td>4.28</td> | |||
</tr> | |||
<tr> | |||
<td>1280x720@30fps</td> | |||
<td> 12 </td> | |||
<td> 1.047 </td> | |||
<td>6.07</td> | |||
</tr> | |||
<tr> | |||
<td>1920x1080@30fps</td> | |||
<td> 16 </td> | |||
<td> 1.277 </td> | |||
<td>10.95</td> | |||
</tr> | |||
<caption>Table 1. Performance for several standard resolutions at 30fps</caption> | |||
</table> | |||
</center> | |||
</html> | |||
<html> | |||
<center> | |||
<table class="wikitable" style="color:black;"> | |||
<tr> | |||
<th>Resolution</th> | |||
<th>Maximum framerate (fps)*</th> | |||
</tr> | |||
<tr> | |||
<td>640x480</td> | |||
<td> 345 </td> | |||
</tr> | |||
<tr> | |||
<td>1280x720</td> | |||
<td> 135 </td> | |||
</tr> | |||
<tr> | |||
<td>1920x1080</td> | |||
<td> 62 </td> | |||
</tr> | |||
<caption>Table 2. Maximum framerate at standard resolutions</caption> | |||
</table> | |||
</center> | |||
</html> | |||
<br> | |||
{{Ambox | |||
|type=notice | |||
|small=left | |||
|issue='''Note:''' take into consideration that these values were taken using the videotestsrc element, and may decrease with a camera source capture. | |||
|style=width:unset; | |||
}} | |||
<br> | |||
===CPU usage=== | |||
These measurements were taken with the '''top''' app to monitor the behavior of the pipeline while running. | |||
[[File:CPU usage Eq.png|frame|center|CPU usage for '''Histogram Equalization''' element]] | |||
===Memory usage=== | |||
These measurements were taken with '''perf stat''' linux tool to measure the bandwidth needed by the pipeline. | |||
[[File:Memory Bandwidth Eq.png|frame|center|Memory bandwidth consumption by '''Histogram Equalization''' element]] | |||
===Execution time=== | |||
These measurements were taken using some '''timestamps''' before and after the processing to measure just the execution time for the kernel algorithm on each frame and hence avoiding possible false measurements from the GStreamer plugin. | |||
[[File:Execution Time Equalizer.png|frame|center|Execution time for different resolutions with the '''Histogram Equalization''' element]] | |||
===Maximum Framerate=== | |||
These measurements were taken with the '''gst-perf''' tool to monitor the behavior of the pipeline while running. When using videotestsrc we are able to process as many buffers as the element can handle, hence the maximum value reported. | |||
The following pipeline was used to test the maximum framerate, please note the use of videotestsrc. | |||
<syntaxhighlight lang=bash style="background-color: #f0fff0"> | |||
$ WIDTH=1920 | |||
$ HEIGHT=1080 | |||
$ gst-launch-1.0 videotestsrc ! "video/x-bayer,format=bggr,width=$WIDTH,height=$HEIGHT,framerate=30/1" ! queue ! ispcleq ! perf ! fakesink -v | |||
</syntaxhighlight> | </syntaxhighlight> | ||
[[File: | [[File:Maximum Framerate Eq.png|frame|center|Framerate for different resolutions with the '''Histogram Equalization''' element]] | ||
<noinclude> | <noinclude> | ||
{{GStreamer Based Image Signal Processor/Foot|Performance/imx6| | {{GStreamer Based Image Signal Processor/Foot|Performance/imx6|Performance/rb5}} | ||
</noinclude> | </noinclude> | ||
Latest revision as of 17:20, 16 January 2024
| GStreamer Image Signal Processor |
|---|
 |
| Image Signal Processor Basics |
| Docs |
| Getting Started |
| Examples |
| Performance |
| Troubleshoot |
| Contact Us |
Benchmark environment
The following setup was used for all the benchmarks:
- NXP® i.MX 8MQuad Evaluation Kit (EVK)
- Yocto built image (fsl-image-multimedia) from Freescale BSP
- i.MX8 5640 RAW10 Camera Module
GStreamer Bayer10 Support
GStreamer has support for 8-bit Bayer only. To enable 10-bit Bayer support, please, follow this wiki.
Performance in other i.MX 8 boards
According to the product comparison available here:
| Family | Subfamilies | GPU | Number of Shaders | Supported by GstISP |
|---|---|---|---|---|
| i.MX 8 | QM, QP |
2x GC7000XSVX | 8 shader/each | Yes |
| i.MX 8X | QXP, DXP, DX | 1x GC7000Lite | 4 shaders | Yes |
| i.MX 8M | Q, D, QL |
1x GC7000Lite | 4 shaders | Yes |
| i.MX 8M Mini | QL, DL, SL, Q, D, S | 1x GCNanoUltra | 1 shader | No (No OpenCL supported) |
| i.MX 8M Nano | QL, DL, SL, Q, D, S | (Q, D, S) 1x GC7000UltraLite (QL, DL, SL) No graphics |
2 shaders | Yes in Q, D, S |
| i.MX 8M Plus | Q, QL, D | 1x GC7000UltraLite | 2 shaders | Yes |
For the measurements, we are using the i.MX 8M Quad (Q), equipped with a GPU GC7000 Lite with 4 shaders. GPUs with fewer shaders may lead to lower performance. We have observed that the ispcldebayer (Debayer) at 1080p works at ~22 fps in an i.MX 8MP is equipped with a GPU with only 2 shaders.
If you are interested in optimisation and achieving higher performance, you can message us at support@ridgerun.com, and we will be glad to team up with you on your project.
CSC Benchmarking
The following section describes some relevant performance measurements for the RGBA to NV12 color space conversion for a few standard resolutions. It begins with a summary of the results detailed in the following sections, as well as the pipelines used to capture such results.
Pipeline
All the measurements below were made using the following minimal pipeline.
$ WIDTH=1920
$ HEIGHT=1080

$ gst-launch-1.0 videotestsrc is-live=true ! "video/x-raw,format=(string)RGBA,width=$WIDTH,height=$HEIGHT,framerate=(fraction)30/1" ! queue ! ispclcsc ! fakesink -v
Summary
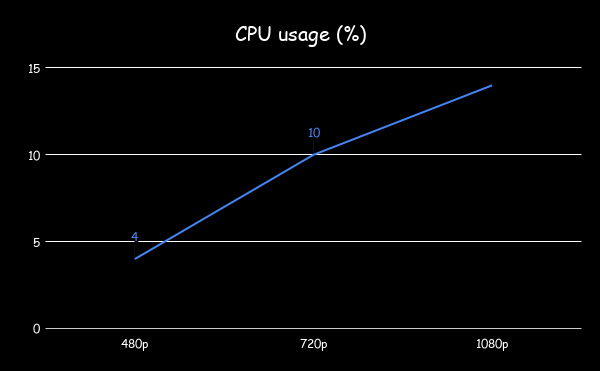
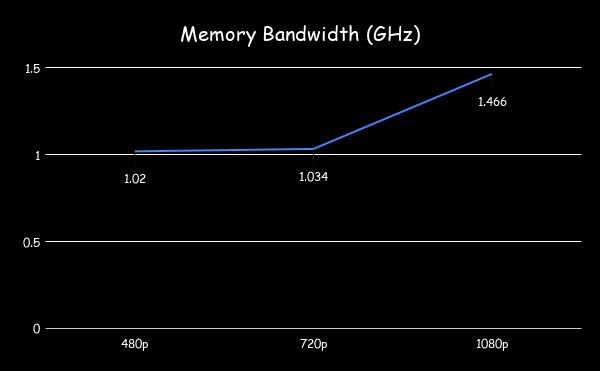
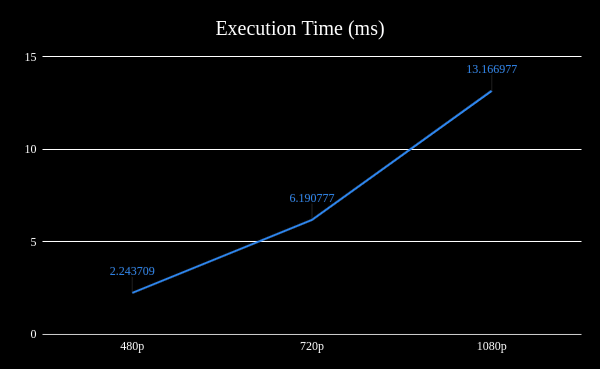
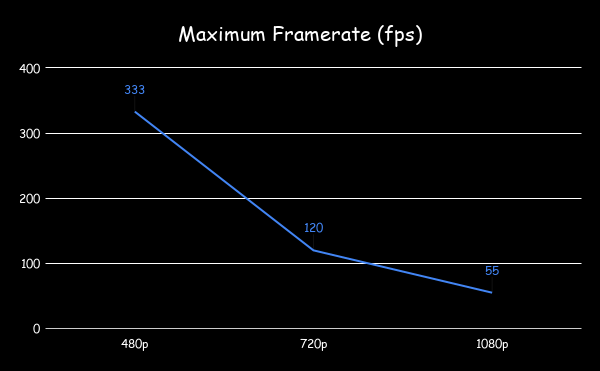
In this summary you can find measurements related with CPU usage, memory, execution time and maximum framerate supported by the CSC algorithm.
| Resolution | CPU usage (%) | Memory Bandwidth (GHz) | Execution Time (ms) |
|---|---|---|---|
| 640x480@30fps | 4 | 1.020 | 2.24 |
| 1280x720@30fps | 10 | 1.034 | 6.19 |
| 1920x1080@30fps | 14 | 1.466 | 13.17 |
| Resolution | Maximum framerate (fps) * |
|---|---|
| 640x480 | 333 |
| 1280x720 | 120 |
| 1920x1080 | 55 |
Note: take into consideration that these values were taken using the videotestsrc element, and may decrease with a camera source capture. |
CPU usage
These measurements were taken with the top app to monitor the behavior of the pipeline while running.
Memory usage
These measurements were taken with perf stat Linux tool to measure the bandwidth needed by the pipeline.
Execution time
These measurements were taken using some timestamps before and after the processing to measure just the execution time for the kernel algorithm on each frame and hence avoiding possible false measurements from the GStreamer plugin.
Maximum Framerate
These measurements were taken with the gst-perf tool to monitor the behavior of the pipeline while running. When using videotestsrc we are able to process as many buffers as the element can handle, hence the maximum value reported.
The following pipeline was used to test the maximum framerate, please note the use of videotestsrc.
$ WIDTH=1920
$ HEIGHT=1080

$ gst-launch-1.0 videotestsrc ! "video/x-raw,format=(string)RGBA,width=$WIDTH,height=$HEIGHT,framerate=(fraction)30/1" ! queue ! ispclcsc ! fakesink -v
Debayer Benckmarking
The following section describes some relevant performance measurements during debayering for a few standard resolutions. It begins with a summary of the results detailed on the following sections, as well as the pipelines used to capture such results.
Pipeline
All the measurements below were made using the following minimal pipeline.
WIDTH=1920
HEIGHT=1080

$ gst-launch-1.0 v4l2src device=/dev/video0 ! video/x-bayer,format=bggr,bpp=10,width=$WIDTH,height=$HEIGHT,framerate=30/1 ! ispclbayer10to8 ! queue ! ispcldebayer ! fakesink -v
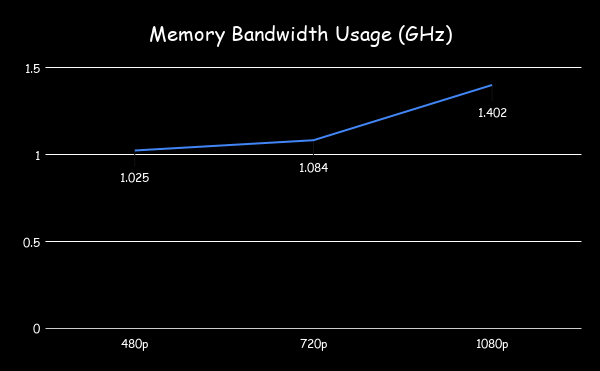
Summary
In this summary you can find measurements related with CPU usage, memory, execution time and maximum framerate supported by the debayer algorithm.
| Resolution | CPU usage (%) | Memory Bandwidth (GHz) | Execution Time (ms) |
|---|---|---|---|
| 640x480@30fps | 2 | 1.025 | 3.54 |
| 1280x720@30fps | 2 | 1.084 | 9.89 |
| 1920x1080@30fps | 3 | 1.402 | 21.46 |
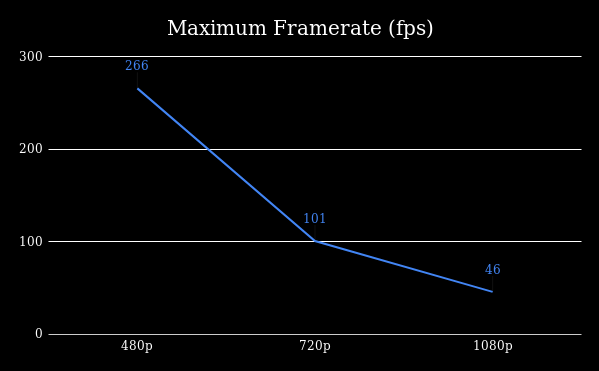
| Resolution | Maximum framerate (fps)* |
|---|---|
| 640x480 | 266 |
| 1280x720 | 101 |
| 1920x1080 | 46 |
Note: take into consideration that these values were taken using the videotestsrc element, and may decrease with a camera source capture. |
CPU usage
These measurements were taken with the top app to monitor the behavior of the pipeline while running.

Memory usage
These measurements were taken with perf stat linux tool to measure the bandwidth needed by the pipeline.
Execution time
These measurements were taken using some timestamps before and after the processing to measure just the execution time for the kernel algorithm on each frame and hence avoiding possible false measurements from the GStreamer plugin.

Maximum Framerate
These measurements were taken with the gst-perf tool to monitor the behavior of the pipeline while running. When using videotestsrc we are able to process as many buffers as the element can handle, hence the maximum value reported.
The following pipeline was used to test the maximum framerate, please note the use of videotestsrc.
$ WIDTH=1920
$ HEIGHT=1080

$ gst-launch-1.0 videotestsrc ! "video/x-bayer,format=bggr,width=$WIDTH,height=$HEIGHT,framerate=30/1" ! queue ! ispcldebayer ! perf ! fakesink -v
AWB Benchmarking
The following section describes some relevant performance measurements for the auto-white balance for a few standard resolutions. It begins with a summary of the results detailed on the following sections, as well as the pipelines used to capture such results.
Pipeline
All the measurements below were made using the following minimal pipeline.
$ WIDTH=1920
$ HEIGHT=1080

$ gst-launch-1.0 v4l2src device=/dev/video0 ! video/x-bayer,format=bggr,bpp=10,width=$WIDTH,height=$HEIGHT,framerate=30/1 ! ispclbayer10to8 ! queue ! ispclawb ! fakesink -v
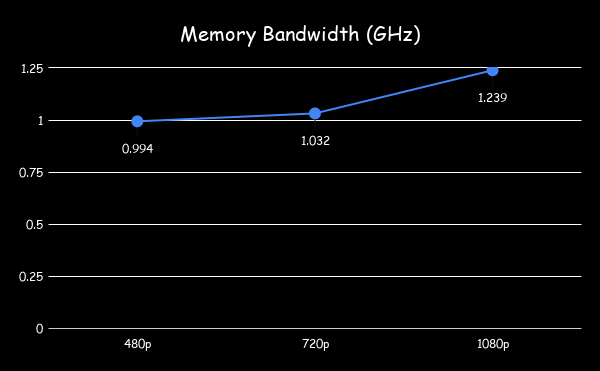
Summary
In this summary you can find measurements related with CPU usage, memory, execution time and maximum framerate supported by the auto-white balance algorithm.
| Resolution | CPU usage (%) | Memory Bandwidth (GHz) | Execution Time (ms) |
|---|---|---|---|
| 640x480@30fps | 10 | 0.994 | 3.11 |
| 1280x720@30fps | 12 | 1.032 | 4.54 |
| 1920x1080@30fps | 16 | 1.239 | 8.52 |
| Resolution | Maximum framerate (fps) * |
|---|---|
| 640x480 | 365 |
| 1280x720 | 135 |
| 1920x1080 | 62 |
Note: take into consideration that these values were taken using the videotestsrc element, and may decrease with a camera source capture. |
CPU usage
These measurements were taken with the top app to monitor the behavior of the pipeline while running.

Memory usage
These measurements were taken with perf stat linux tool to measure the bandwidth needed by the pipeline.
Execution time
These measurements were taken using some timestamps before and after the processing to measure just the execution time for the kernel algorithm on each frame and hence avoiding possible false measurements from the GStreamer plugin.

Maximum Framerate
These measurements were taken with the gst-perf tool to monitor the behavior of the pipeline while running. When using videotestsrc we are able to process as many buffers as the element can handle, hence the maximum value reported.
The following pipeline was used to test the maximum framerate, please note the use of videotestsrc.
$ WIDTH=1920
$ HEIGHT=1080

$ gst-launch-1.0 videotestsrc ! "video/x-bayer,format=bggr,width=$WIDTH,height=$HEIGHT,framerate=30/1" ! queue ! ispclawb ! perf ! fakesink -v

Histogram Equalization Benchmarking
The following section describes some relevant performance measurements for the Histogram Equalization for a few standard resolutions. It begins with a summary of the results detailed on the following sections, as well as the pipelines used to capture such results.
Pipeline
All the measurements below were made using the following minimal pipeline.
$ WIDTH=1920
$ HEIGHT=1080

$ gst-launch-1.0 v4l2src device=/dev/video0 ! video/x-bayer,format=bggr,bpp=10,width=$WIDTH,height=$HEIGHT,framerate=30/1 ! ispclbayer10to8 ! queue ! ispcleq ! fakesink -v
Summary
In this summary you can find measurements related with CPU usage, memory, execution time and maximum framerate supported by the Histogram Equalization algorithm.
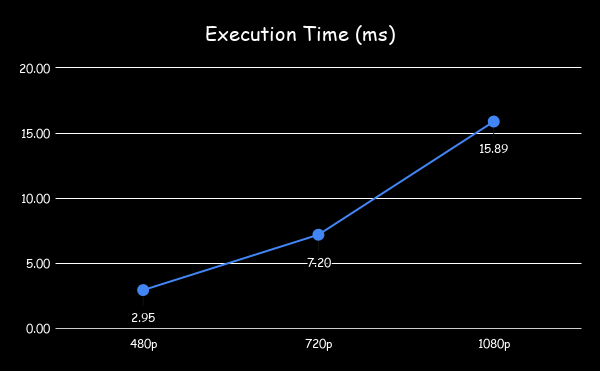
| Resolution | CPU usage (%) | Memory Bandwidth (GHz) | Execution Time (ms) |
|---|---|---|---|
| 640x480@30fps | 10 | 0.990 | 4.28 |
| 1280x720@30fps | 12 | 1.047 | 6.07 |
| 1920x1080@30fps | 16 | 1.277 | 10.95 |
| Resolution | Maximum framerate (fps)* |
|---|---|
| 640x480 | 345 |
| 1280x720 | 135 |
| 1920x1080 | 62 |
Note: take into consideration that these values were taken using the videotestsrc element, and may decrease with a camera source capture. |
CPU usage
These measurements were taken with the top app to monitor the behavior of the pipeline while running.

Memory usage
These measurements were taken with perf stat linux tool to measure the bandwidth needed by the pipeline.

Execution time
These measurements were taken using some timestamps before and after the processing to measure just the execution time for the kernel algorithm on each frame and hence avoiding possible false measurements from the GStreamer plugin.
Maximum Framerate
These measurements were taken with the gst-perf tool to monitor the behavior of the pipeline while running. When using videotestsrc we are able to process as many buffers as the element can handle, hence the maximum value reported.
The following pipeline was used to test the maximum framerate, please note the use of videotestsrc.
$ WIDTH=1920
$ HEIGHT=1080

$ gst-launch-1.0 videotestsrc ! "video/x-bayer,format=bggr,width=$WIDTH,height=$HEIGHT,framerate=30/1" ! queue ! ispcleq ! perf ! fakesink -v

