GstShark - Queue Level tracer: Difference between revisions
(Created page with "{{GstShark Tracer |prev=Bitrate tracer |next=Buffer tracer |name=Queue Level |description= |pipeline= |graph= }}") |
mNo edit summary |
||
| (9 intermediate revisions by 3 users not shown) | |||
| Line 1: | Line 1: | ||
{{GstShark | {{GstShark/Head |previous=Bitrate tracer|next=Buffer tracer|metakeywords=}} | ||
| | |||
The Queue Level tracer measures the amount of data queued in every queue element in the pipeline. A new trace will be printed every time a buffer enters a queue. | |||
This data is specially useful when debugging latency and performance bottlenecks. The queue level will provide the developer with additional data to debug queue underruns and other related problems. | |||
|pipeline= | <br><br> | ||
| | <table> | ||
}} | <tr> | ||
<td><div class="clear; float:right">__TOC__</div></td> | |||
<td valign=top> | |||
{{GStreamer debug}} | |||
</td> | |||
</table> | |||
==Pipeline== | |||
The following pipeline demonstrates how to use the queuelevel tracer and the results obtained with it. Queue elements with specific maximum sizes are used to simulate constrained queue elements. This forced maximum should be reflected on the measurements for every element on the output log of the tracer. | |||
<syntaxhighlight lang=bash> | |||
$ GST_DEBUG="GST_TRACER:7" GST_TRACERS="queuelevel" gst-launch-1.0 videotestsrc ! 'video/x-raw, format=(string)YUY2, width=(int)640, height=(int)480, framerate=(fraction)30/1' ! videorate max-rate=30 ! videoconvert ! queue max-size-buffers=20 ! avenc_h263p ! queue max-size-time=400000000 ! avimux ! fakesink sync=true | |||
</syntaxhighlight> | |||
==Graph== | |||
[[File:queuelevel_test.png|1000px|center]] | |||
==Output== | |||
<font size=1> | |||
<pre> | |||
0:00:05.558210906 21193 0x5622294ee8f0 TRACE GST_TRACER :0:: queuelevel, queue=(string)queue0, size_bytes=(uint)9216000, max_size_bytes=(uint)10485760, size_buffers=(uint)20, max_size_buffers=(uint)20, size_time=(string)0:00:00.666666667, max_size_time=(string)0:00:01.000000000; | |||
0:00:05.591457397 21193 0x5622294ee850 TRACE GST_TRACER :0:: queuelevel, queue=(string)queue1, size_bytes=(uint)60587, max_size_bytes=(uint)10485760, size_buffers=(uint)11, max_size_buffers=(uint)200, size_time=(string)0:00:00.366666667, max_size_time=(string)0:00:00.400000000; | |||
</pre></font> | |||
Each line of the log includes a {{code|queue}} field identifying the element being measured, and six fields with the measurement of the queue level in bytes, buffers, time and the maximum value for each one. | |||
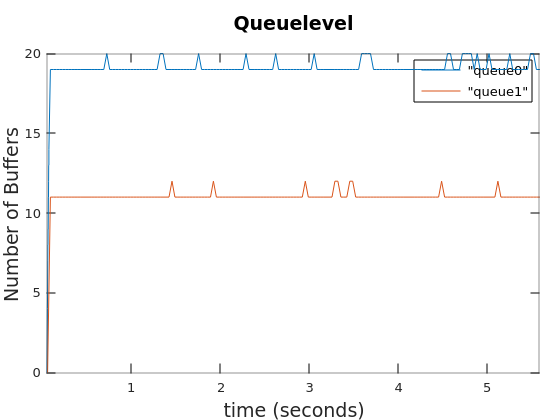
The results show the queue levels at the maximum established by the limits set on the pipeline. In practical applications, the queue level may be constrained by bottlenecks that do not provide the queue with enough data. | |||
==Plot== | |||
[[File:Gstshark-examples-queuelevel.png|560px|center]] | |||
{{GstShark/Foot|previous=Bitrate tracer|next=Buffer tracer}} | |||
Latest revision as of 03:09, 6 March 2023
Open-source project from Ridgerun. |
| GstShark |
|---|
| Getting Started |
| Generating trace files |
| Tracer Parameters |
| Available Tracers |
| Results |
| Visualization Tools |
| Examples |
| Contact Us |
The Queue Level tracer measures the amount of data queued in every queue element in the pipeline. A new trace will be printed every time a buffer enters a queue.
This data is specially useful when debugging latency and performance bottlenecks. The queue level will provide the developer with additional data to debug queue underruns and other related problems.
|
Pipeline
The following pipeline demonstrates how to use the queuelevel tracer and the results obtained with it. Queue elements with specific maximum sizes are used to simulate constrained queue elements. This forced maximum should be reflected on the measurements for every element on the output log of the tracer.
$ GST_DEBUG="GST_TRACER:7" GST_TRACERS="queuelevel" gst-launch-1.0 videotestsrc ! 'video/x-raw, format=(string)YUY2, width=(int)640, height=(int)480, framerate=(fraction)30/1' ! videorate max-rate=30 ! videoconvert ! queue max-size-buffers=20 ! avenc_h263p ! queue max-size-time=400000000 ! avimux ! fakesink sync=true
Graph

Output
0:00:05.558210906 21193 0x5622294ee8f0 TRACE GST_TRACER :0:: queuelevel, queue=(string)queue0, size_bytes=(uint)9216000, max_size_bytes=(uint)10485760, size_buffers=(uint)20, max_size_buffers=(uint)20, size_time=(string)0:00:00.666666667, max_size_time=(string)0:00:01.000000000;
0:00:05.591457397 21193 0x5622294ee850 TRACE GST_TRACER :0:: queuelevel, queue=(string)queue1, size_bytes=(uint)60587, max_size_bytes=(uint)10485760, size_buffers=(uint)11, max_size_buffers=(uint)200, size_time=(string)0:00:00.366666667, max_size_time=(string)0:00:00.400000000;
Each line of the log includes a queue field identifying the element being measured, and six fields with the measurement of the queue level in bytes, buffers, time and the maximum value for each one.
The results show the queue levels at the maximum established by the limits set on the pipeline. In practical applications, the queue level may be constrained by bottlenecks that do not provide the queue with enough data.
Plot

